2. Verification and Validation
2.1. 2D Column 1D Shaking
A 2D free field effective stress analysis is performed by s3hark
and demonstrated in this section.
The simulation is described in a json file, which can be downloaded from
this link.
This file can be loaded by s3hark to build the analysis automatically.
The ground motion used in this simulation can be downloaded from
here.
The results are verified against FLAC and
Plaxis. The soil column being analyzed is 6 meters high sitting on a
rock. The ground water table is at 2 meters below the soil surface.
In the column, there are a total of three soil layers. Each layer is
meshed by elements with a size of 0.25 meter in height. Basic
properties of soil layers and the rock are shown
in Fig. 2.1.1 and Fig. 2.1.2. The
first two layers are modeled by PM4Sand and the third layer is modeled
by elastic isotropic material. (The implementation work of
PM4Sand [BZ15] is done in University of
Washington by Long Chen and Pedro Arduino. Chaofeng Wang at UC,
Berkeley contributed to the code optimization for speed improvement. )
The rock layer will be simplified to a [LK69] dashpot,
which accounts for the finite rigidity of the underlying elastic
medium. The parameters of the dashpot are calculated solely based on
rock layer’s density and \(V_{s30}\).
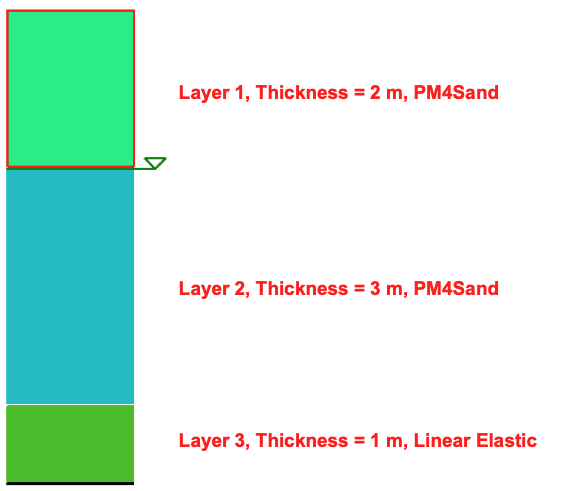
Fig. 2.1.1 Soil layers

Fig. 2.1.2 Basic information of each layer
The detailed properties of the material in each soil layer are shown in Fig. 2.1.3, Fig. 2.1.4 and Fig. 2.1.5.
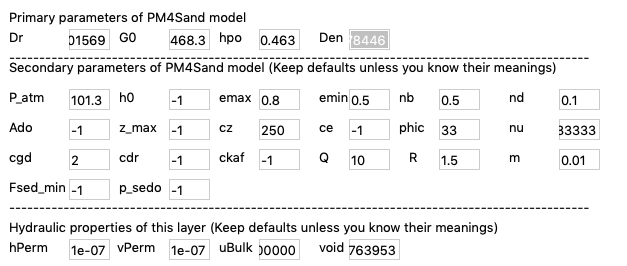
Fig. 2.1.3 Layer 1
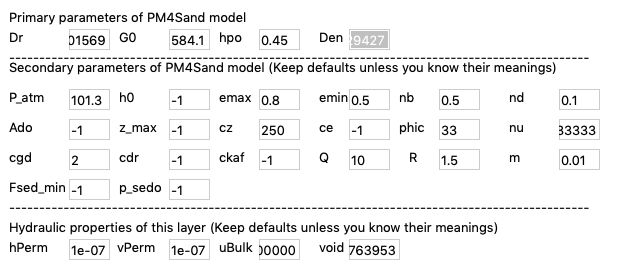
Fig. 2.1.4 Layer 2
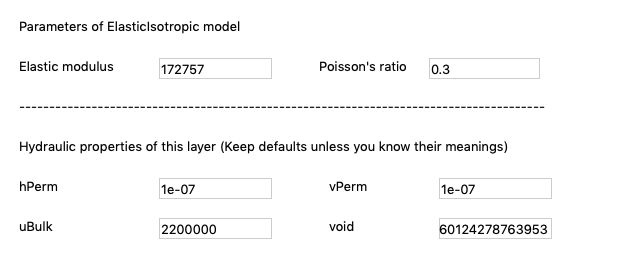
Fig. 2.1.5 Layer 3
For the verification and validation purposes, s3hark’s results are compared with FLAC an PLAXIS, as shown in Fig. 2.1.6. All three programs generally produce very similar response with different levels of differences shown in PHA, maximum shear strain, CSR, maximum pore pressure ratio. The differences come from multiple sources, such as numerical discretization methods, solvers, etc. For example, FLAC tends to produce higher dilation pulses in liquefied layer. This is possibly due to a combination of different reasons, e.g., interpolation of data from integration points at different locations, numerical methods for integration, formulations for solid fluid coupling, etc. (Long Chen and Andrew Makdisi at University of Washington, Gregor Vilhar at PLAXIS BV, Chaofeng Wang at UC, Berkeley contributed to the verification of PM4Sand in s3hark.)
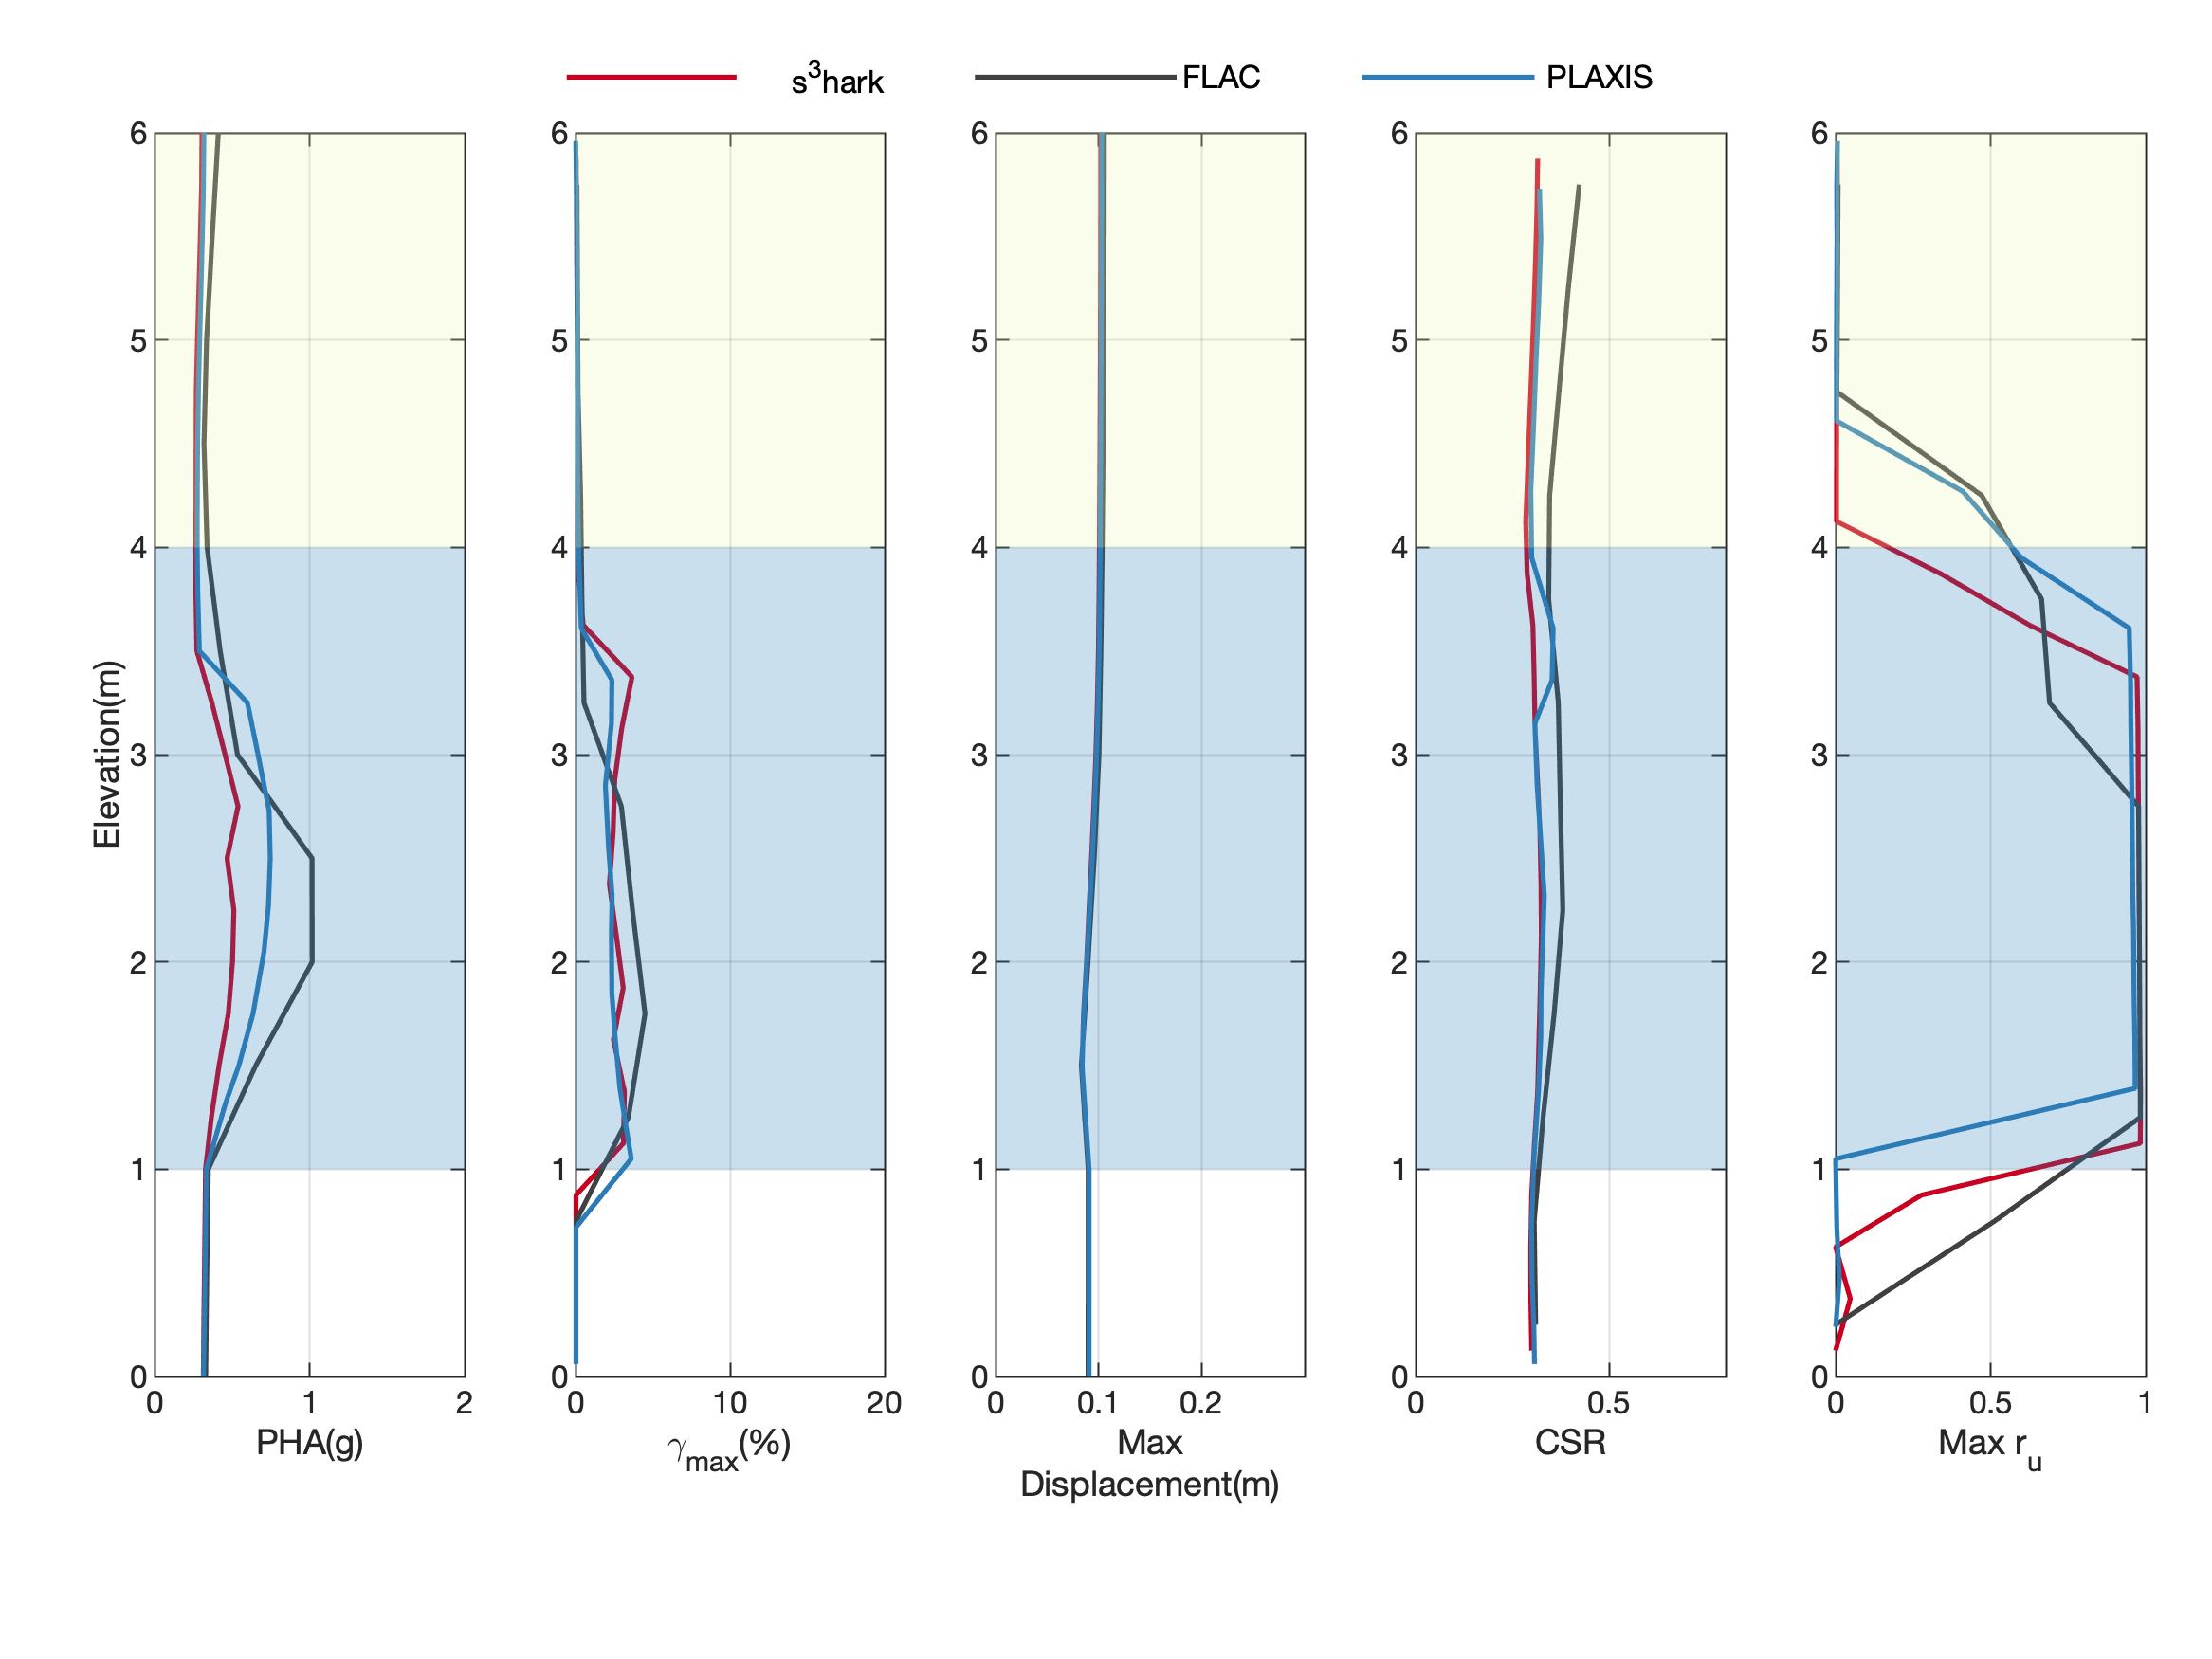
Fig. 2.1.6 Compare with FLAC and PLAXIS
2.2. 3D Column Bidirectional Shaking
A 3D free field effective stress analysis is performed by s3hark and demonstrated in this section. The results are verified against OpenSees. The soil column being analyzed is 30 meters high sitting on a rock. The ground water table is at 2 meters below the soil surface. In the column, there are a total of three soil layers. Each layer is meshed by elements with a size of 0.5 meter in height. Basic properties of soil layers and the rock are shown in Fig. 2.2.1 and Fig. 2.2.2. The layers are modeled by PDMY02 material. The rock layer will be simplified to a [LK69] dashpot, which accounts for the finite rigidity of the underlying elastic medium. The parameters of the dashpot are calculated solely based on rock layer’s density and \(V_{s30}\). The slope parameters are set to be \(\alpha=1.145762838175103^{\circ}\) and \(\beta=-90^{\circ}\)
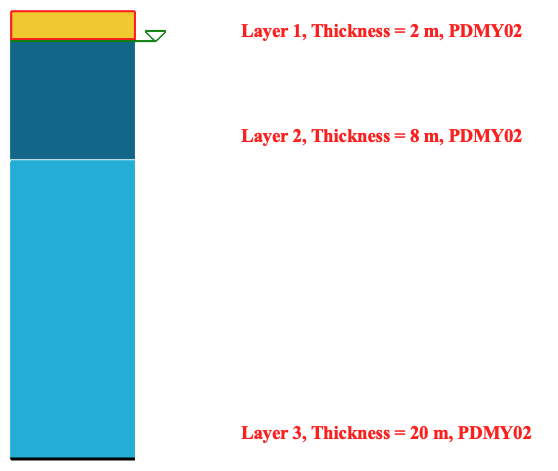
Fig. 2.2.1 Soil layers of a 3D column

Fig. 2.2.2 Soil layers of a 3D column
The ground motion used in this simulation can be downloaded from
here.
The simulation itself is described in a json file, which can be downloaded from
this link.
This file can be loaded by s3hark to build the analysis automatically.
It includes all the configurations, the soil table and parameters for each layer - all the information needed to reproduce the simulation.
In s3hark, go to the menu and choose to open and load this json file into the application,
You’ll see the detailed properties of the material in each soil layer as those shown
in Figures Fig. 2.2.3, Fig. 2.2.4, Fig. 2.2.5 and Fig. 2.2.6.
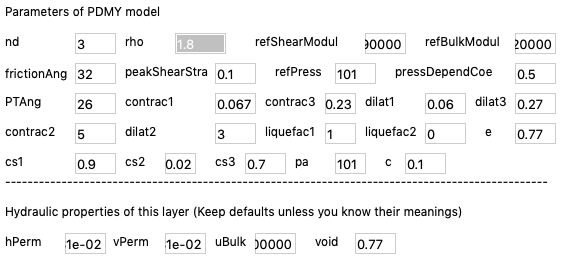
Fig. 2.2.3 Detail soil properties and material model parameters of a 3D column: Layer 1
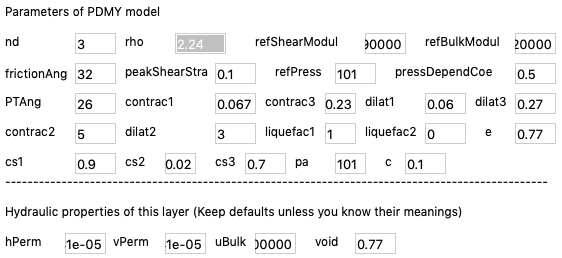
Fig. 2.2.4 Detail soil properties and material model parameters of a 3D column: Layer 2
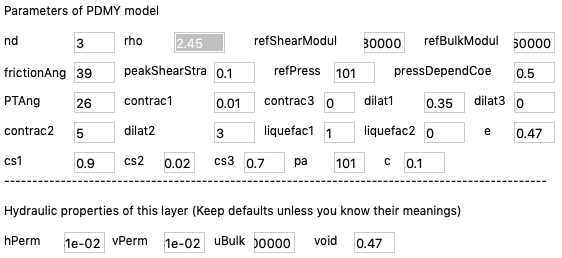
Fig. 2.2.5 Detail soil properties and material model parameters of a 3D column: Layer 3
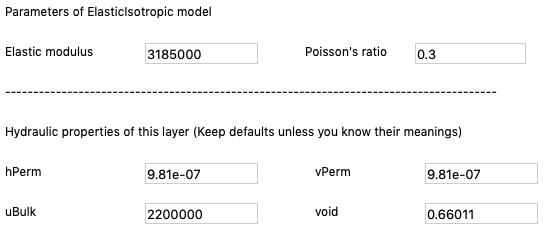
Fig. 2.2.6 Detail soil properties and material model parameters of a 3D column: Rock
In the Configure tab, put the path of the downloaded motion file into Rock motion.
Then, click the Analyze button to perform the simulation.
For the verification and validation purposes, s3hark’s results are compared with OpenSees,
as shown in Fig. 2.2.7.
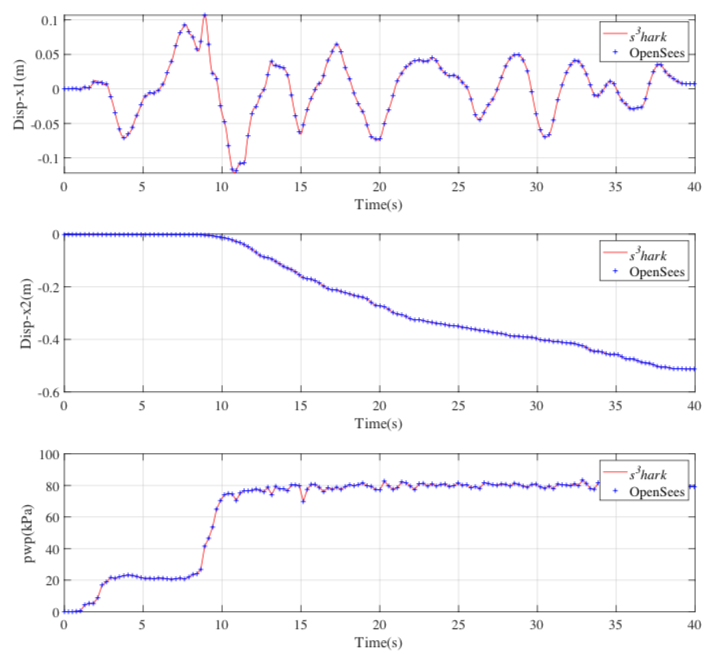
Fig. 2.2.7 Compare with OpenSees
| [Bio41] | Maurice A Biot. General theory of three-dimensional consolidation. Journal of applied physics, 12(2):155–164, 1941. |
| [Bio55] | Maurice A Biot. Theory of elasticity and consolidation for a porous anisotropic solid. Journal of applied physics, 26(2):182–185, 1955. |
| [BW57] | Maurice A Biot and DG Willis. The elastic coeff cients of the theory of consolidation. J Appl Mech, 15:594–601, 1957. |
| [BA94] | Ronaldo I Borja and Alexander P Amies. Multiaxial cyclic plasticity model for clays. Journal of geotechnical engineering, 120(6):1051–1070, 1994. |
| [BZ15] | R. W Boulanger and K Ziotopoulou. Pm4sand (version 3): a sand plasticity model for earthquake engineering applications. Center for Geotechnical Modeling Report No. UCD/CGM-15/01, Department of Civil and Environmental Engineering, University of California, Davis, California, 2015. |
| [BZ18] | Ross W Boulanger and Katerina Ziotopoulou. Pm4silt (version 1): a silt plasticity model for earthquake engineering applications. Report No. UCD/CGM-18/01, Center for Geotechnical Modeling, Department of Civil and Environmental Engineering, University of California, Davis, CA, 108 pp., 2018. |
| [DM04] | Yannis F Dafalias and Majid T Manzari. Simple plasticity sand model accounting for fabric change effects. Journal of Engineering mechanics, 130(6):622–634, 2004. |
| [EI65] | A Cemal Eringen and John D Ingram. A continuum theory of chemically reacting media—i. International Journal of Engineering Science, 3(2):197–212, 1965. |
| [GN65] | Albert Edward Green and Paul Mansour Naghdi. A dynamical theory of interacting continua. International journal of engineering Science, 3(2):231–241, 1965. |
| [GCEY09] | Quan Gu, Joel P Conte, Ahmed Elgamal, and Zhaohui Yang. Finite element response sensitivity analysis of multi-yield-surface j2 plasticity model by direct differentiation method. Computer methods in applied mechanics and engineering, 198(30-32):2272–2285, 2009. |
| [IE67] | John D Ingram and A Cemal Eringen. A continuum theory of chemically reacting media—ii constitutive equations of reacting fluid mixtures. International Journal of Engineering Science, 5(4):289–322, 1967. |
| [LK69] | (1, 2) John Lysmer and Roger L Kuhlemeyer. Finite dynamic model for infinite media. Journal of the Engineering Mechanics Division, 95(4):859–878, 1969. |
| [Prevost80] | Jean H Prévost. Mechanics of continuous porous media. International Journal of Engineering Science, 18(6):787–800, 1980. |
| [Ter43] | Karl Terzaghi. Theoretical soil mechanics. johnwiley & sons. New York, pages 11–15, 1943. |
| [YEP03] | Zhaohui Yang, Ahmed Elgamal, and Ender Parra. Computational model for cyclic mobility and associated shear deformation. Journal of Geotechnical and Geoenvironmental Engineering, 129(12):1119–1127, 2003. |