3. Generalization
When applying the pre-trained models or training models with your own data, it is important to review the results for a sample of the data. This is because how well these models perform to new and unseen data depends on how similar they are to the training data. Generalization of machine learning models remains an active research area. Users should exercise cautions when the modules are used beyond their intended purposes and trained model ability.
In this section, we show an example to demonstrate that different training datasets can produce difference accuracies and how important it is to review sample results and retrain the models as necessary.
We will demonstrate this through the example of our Occupancy classifier, Occupancy Classifier, which is a classifier to predict the occupancy type of a building given the street view image of the building.
The original training for this classifier was performed using OpenSeesMap (OSM). From we collected images from random records of the United Sates building ineventory which had their from occupancy type labelled. These labels include ‘detached’, ‘apartment’, and ‘commercial’. We renamed the labels to be consistent with the HAZUS naming system: ‘RES1’, ‘RES3’, ‘COM’, which was needed for our testbed. For each building a street view image was then downloaded from Google Street Maps. Buildings that were not clearly visible in the street view image were ignored.
The image set was then split into a training and a testing set.
The training set (OSM-1) included:
2,868 RES1
2,207 RES3
2,418 COM
The testing set (OSM-2) included:
98 RES1
97 RES3
98 COM
A ResNet50 model (model-1) is trained on the training set and tested on the testing set following the procedure described in Occupancy Classifier. For each class the accuracy is 100%, as shown in the confusion matrix Fig. 3.1.
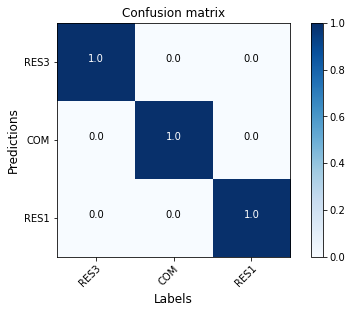
Fig. 3.1 Confusion matrix (model-1 on OSM-2)
The performance is very high on the OSM testing set.
We further obtained another dataset from New Jersey Department of Environmental Protection (NJDEP). This dataset only covers buildings from New Jersey, in which each building’s occupancy type is labeled. Form this inventory consisting over XX buildings, two sample sets weere chosen:
The first set (NJDEP-1) contains:
4,999 RES1
2,867 RES3
386 COM
The second set (NJDEP-2) contains:
812 RES1
905 RES3
837 COM
We tested model-1 on the NJDEP-2 dataset. It’s performance is plotted in the confusion matrix Fig. 3.2. The performance dropped significantly on this dataset.

Fig. 3.2 Confusion matrix (model-1 on NJDEP-2)
Later, another ResNet50 model (model-2) is trained on the combined dataset OSM-1 + NJDEP-1. The new model is tested on two datasets, OSM-2 and NJDEP-2, again. As shown in Fig. 3.3 and Fig. 3.4. The new models’ performance on the OSM-2 dataset drops a bit, while it improved significantly on the NJDEP-2 dataset.
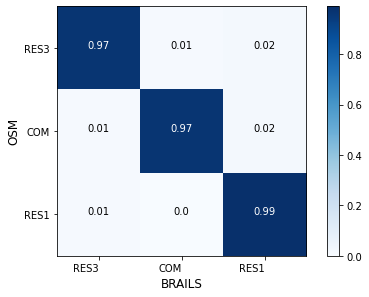
Fig. 3.3 Confusion matrix (model-2 on OSM-2)
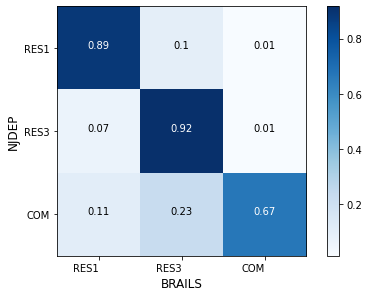
Fig. 3.4 Confusion matrix (model-2 on NJDEP-2)