3.2. Response to Stochastic Ground Motion
The purpose of this analysis is to verify that EE-UQ app is able to reproduce the correct pseudo-acceleration response spectrum when using synthetic acceleration time histories generated using the stochastic ground motion model option as the seismic event. The maximum pseudo-acceleration for a single-degree-of-freedom system with varying natural frequencies calculated by EE-UQ app is compared to the values predicted by smelt as well as the geometric mean of the four NGA-West2 ground motion prediction equations (GPMEs) that account for soil sites. The scenario considered in this verification example is an event with a Moment Magnitude (\(M_W\)) of 6.5, closest-to-site rupture distance (\(R_{rupt}\)) of 20 km, and average shear-wave velocity in the top 30 m of soil (\(V_{s30}\)) equal to 400 m/s.
The single-degree-of-freedom system was input using the MDOF option as the Building Model Input in EE-UQ app. Here, the mass was set to unity and the damping ratio to 5%. The story stiffness was modified to set the natural frequency of the system in order to calculate the response spectrum. The structural response was calculated for 10 sample synthetic acceleration time histories for each structural period and compared to those from smelt and the GMPEs, as shown in Fig. 3.2.1. As can be seen in this figure, the spectral response calculated by EE-UQ app falls within the mean plus/minus one sigma bounds of the GMPEs and smelt while tending toward the mean. This produces the expected result as EE-UQ app is calling smelt in the backend to generate the synthetic motions. The full validation of smelt in implementing the predictive stochastic model proposed by Vlachos et al. (2018) vlachos2018predictive can be found in the smelt library documentation.
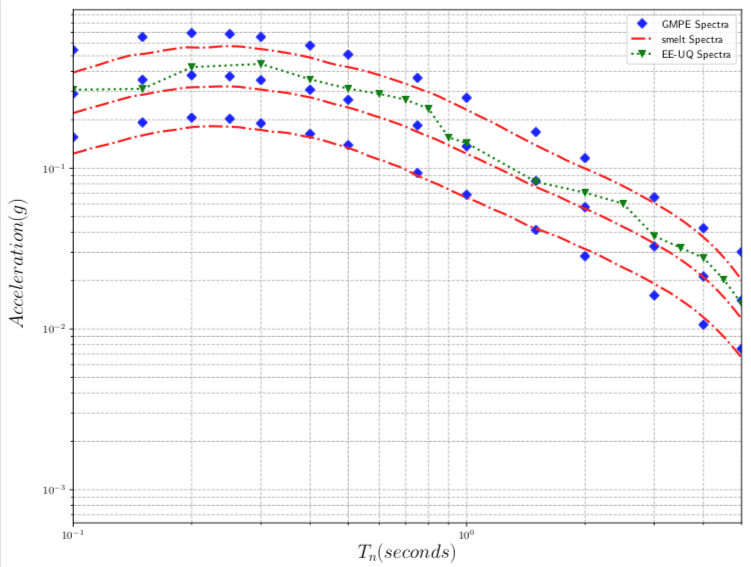
Fig. 3.2.1 Response spectra generated using NGA-West2 GMPEs, smelt & EE-UQ for \(M_W = 6.5\), closest-to-site distance \(R_{rupt} = 20km\), and average shear-wave velocity \(V_{s30} = 400 \frac{m}{s}\).
Note
The smelt and GMPE spectra show the mean and mean plus/minus one logarithmic standard deviation. The GMPE spectra are based on the geometric mean of the four NGA-West2 models that account for site soil conditions. The smelt spectra are based on an ensemble of 1000 synthetic ground motions. EE-UQ app response values are based on the mean pseudo-acceleration for 10 synthetic ground motion samples per period, \(T_n\).