2.1. Roof Classifier
The Roof Classifier’s methodology has been presented in Roof type classifier, and examples showing how to use it can be found in Roof Shape Classifier. This section presents its validation against two datasets.
Dataset 1: Compare with OpenStreetMap Labels
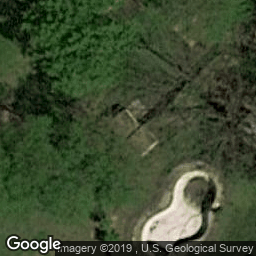
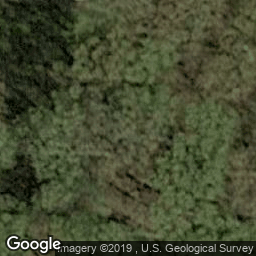
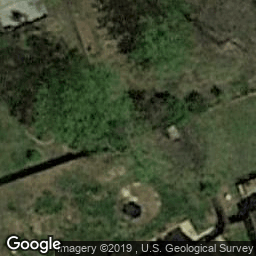
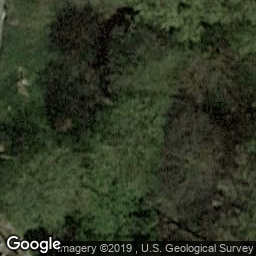
The trained classifier is first tested on a ground truth dataset that can be downloaded from Zenodo. This data set was obtained by randomly selecting from OpenStreetMap a series of buildings for which a roof:shape entry existed and it was one of: hipped, flat or gabled. Some options in Open Street Maps include: gambrel, pyramidal skillion, half-hipped, gambrel, dome, onion, round, sailbox. The google map API was then used to download satellite images of these buildings. From the downloaded images, images for which no roof was visible were removed, examples of removed images are as shown in Table 2.1.4.
|
|
|
|
The resulting dataset contained little over a hundred images: 32 flat, 40 gabled, 52 hipped. Examples of these satellite images are as shown below:
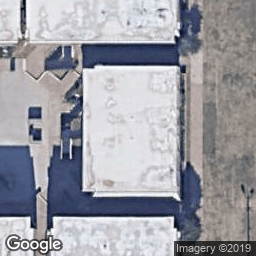
Fig. 2.1.1 Flat¶ |
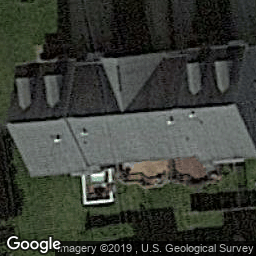
Fig. 2.1.2 Gabled¶ |
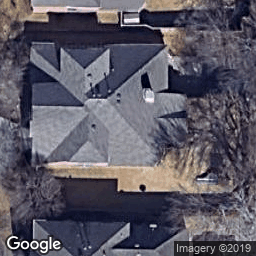
Fig. 2.1.3 Hipped¶ |
The following code was then used to predict the roof shape.
import shutil
import os
import pandas as pd
from glob import glob
import wget
import zipfile

# download the testing dataset
wget.download('https://zenodo.org/record/4520781/files/satellite-images-val.zip')
with zipfile.ZipFile('satellite-images-val.zip', 'r') as zip_ref:
    zip_ref.extractall('.')

# get images
flatList = glob('satellite-images-val/flat/*.png')
gabledList = glob('satellite-images-val/gabled/*.png')
hippedList = glob('satellite-images-val/hipped/*.png')

# define the paths of images in a list
imgs=flatList+gabledList+hippedList

# import the module
from brails.modules import RoofClassifier

# initialize a roof classifier
roofModel = RoofClassifier()

# use the model to predict
predictions = roofModel.predict(imgs)

prediction = predictions['prediction'].values.tolist()
label = ['flat']*len(flatList) + ['gabled']*len(gabledList) + ['hipped']*len(hippedList)

# lot results
class_names = ['flat','gabled', 'hipped']
from brails.utils.plotUtils import plot_confusion_matrix
from sklearn.metrics import confusion_matrix
from sklearn.metrics import f1_score,accuracy_score

# print
print(' Accuracy is   : {}, Random guess is 0.33'.format(accuracy_score(prediction,label)))
cnf_matrix = confusion_matrix(prediction,label)
plot_confusion_matrix(cnf_matrix, classes=class_names, title='Confusion matrix',normalize=True,xlabel='Labels',ylabel='Predictions')
Note
The code presented is similar to what was shown in the Roof Shape Classifier. It demonstrates how python can be used to generate the list of images to be classified.
The prediction accuracy on this dataset is 90.3%. Precision is 90.3%. Recall is 90.3%. F1 is 90.3%.
The confusion matrix for this validation is shown in Fig. 2.1.4.
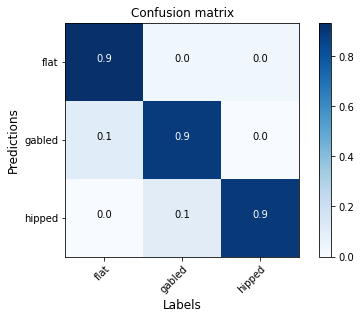
Fig. 2.1.4 Confusion matrix - Roof type classification for OpenStreetMap
Dataset 2: Compare with StEER Hurricane Laura Dataset
The second validation dataset was obtained from StEER. From StEER, we obtained a list of addresses with their roof types labelled. For each address, we downloaded an satellite image from Google Maps Static API.
Note
This dataset contains satellite images of buildings, most images were taken before Hurricane Laura.
The dataset is available from Zenodo.
The labeling system of StEER is different from the BRAILS roof classification system. The StEER labels include the following classes:
Gable/Hip Combo
Hip
Gable
Complex
Flat
While the BRAILS roof types only include the following classes:
gabled
hipped
flat
To compare these two systems, from the StEER dataset we selected only addresses labeled as ‘Flat’, ‘Gable’, ‘Hip’. As a consequence, the set of buildings for which the validation was perfomed contained the following number of images:
hipped, 33
gabled, 21
flat , 2
The following shows the script to run this validation.
# ### Load labels and predictions from The Lake Charles Testbed

import pandas as pd

data = pd.read_csv('StEER_Laura.csv')
data.describe()

data = data[(data['RoofShape(StEER)']=='Hip') |
              (data['RoofShape(StEER)']=='Gable') |
              (data['RoofShape(StEER)']=='Flat')]

roofDict = {'Gable':'gabled','Flat':'flat','Hip':'hipped'}
data['RoofShape(StEER)']=data['RoofShape(StEER)'].apply(lambda x: roofDict[x])
data['RoofShape(Testbed)']=data['RoofShape(Testbed)'].apply(lambda x: roofDict[x])


# ### Plot confusion matrix

import sys
sys.path.append(".")
from plotUtils import plot_confusion_matrix
from sklearn.metrics import confusion_matrix
from sklearn.metrics import f1_score,accuracy_score,f1_score

class_names = list(data['RoofShape(Testbed)'].unique())

predictions = data['RoofShape(Testbed)']
labels = data['RoofShape(StEER)']

cnf_matrix = confusion_matrix(labels,predictions)
plot_confusion_matrix(cnf_matrix, classes=class_names, title='Confusion matrix',normalize=True,xlabel='BRAILS',ylabel='StEER')

for i,cname in enumerate(class_names):
    accuracy = '%.1f'%(cnf_matrix[i][i]/sum(cnf_matrix[i]))
    TP = cnf_matrix[i][i]
    FP = sum(cnf_matrix[:,i])-cnf_matrix[i,i]
    FN = sum(cnf_matrix[i,:])-cnf_matrix[i,i]
    F1 = '%.1f'%(TP/(TP+0.5*(FP+FN)))

    print(f'{cname}: Accuracy = {accuracy}, F1 = {F1}')


# ### Copy images to directories {label}-{prediction} for inspection

import os
import shutil

predDir = 'tmp/images/roof_predictions'
if not os.path.exists(predDir):
    os.makedirs(predDir)

falseNames = []
def copyfiles(bim):
    for ind, row in bim.iterrows():
        label = row['RoofShape(StEER)']
        pred = row['RoofShape(Testbed)']

        lon, lat = '%.6f'%row['Longitude'], '%.6f'%row['Latitude']

        oldfile = f'tmp/images/TopView/TopViewx{lon}x{lat}.png'
        newfile = f'{predDir}/{label}-{pred}/TopViewx{lon}x{lat}.png'

        thisFileDir = f'{predDir}/{label}-{pred}/'
        if not os.path.exists(thisFileDir): os.makedirs(thisFileDir)

        try:
            shutil.copyfile(oldfile, newfile)
        except:
            print(oldfile)

copyfiles(data)
The confusion matrix tested on this dataset is shown in Fig. 2.1.5.
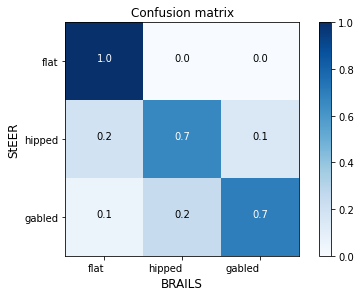
Fig. 2.1.5 Confusion matrix - Roof type classification for Hurricane Laura
The accuracy for the three classes are:
flat: Accuracy = 1.0, F1 = 0.4
hipped: Accuracy = 0.7, F1 = 0.7
gabled: Accuracy = 0.7, F1 = 0.8