2.4.9. Experimental Wind Force
The application takes multivariate stationary wind force time series data obtained from a wind tunnel experiment and can generate multiple realizations of the full-scale multivariate Gaussian wind force time series that is accurate up to the second-order properties (i.e., mean, CPSD functions, correlation) of the input data. Based on the Central Limit Theorem, the wind forces can be approximately modeled as Gaussian processes due to the integral effects of the incident pressures. This algorithm follows the implementation details in [Duarte2023] and the theory manual is available here.
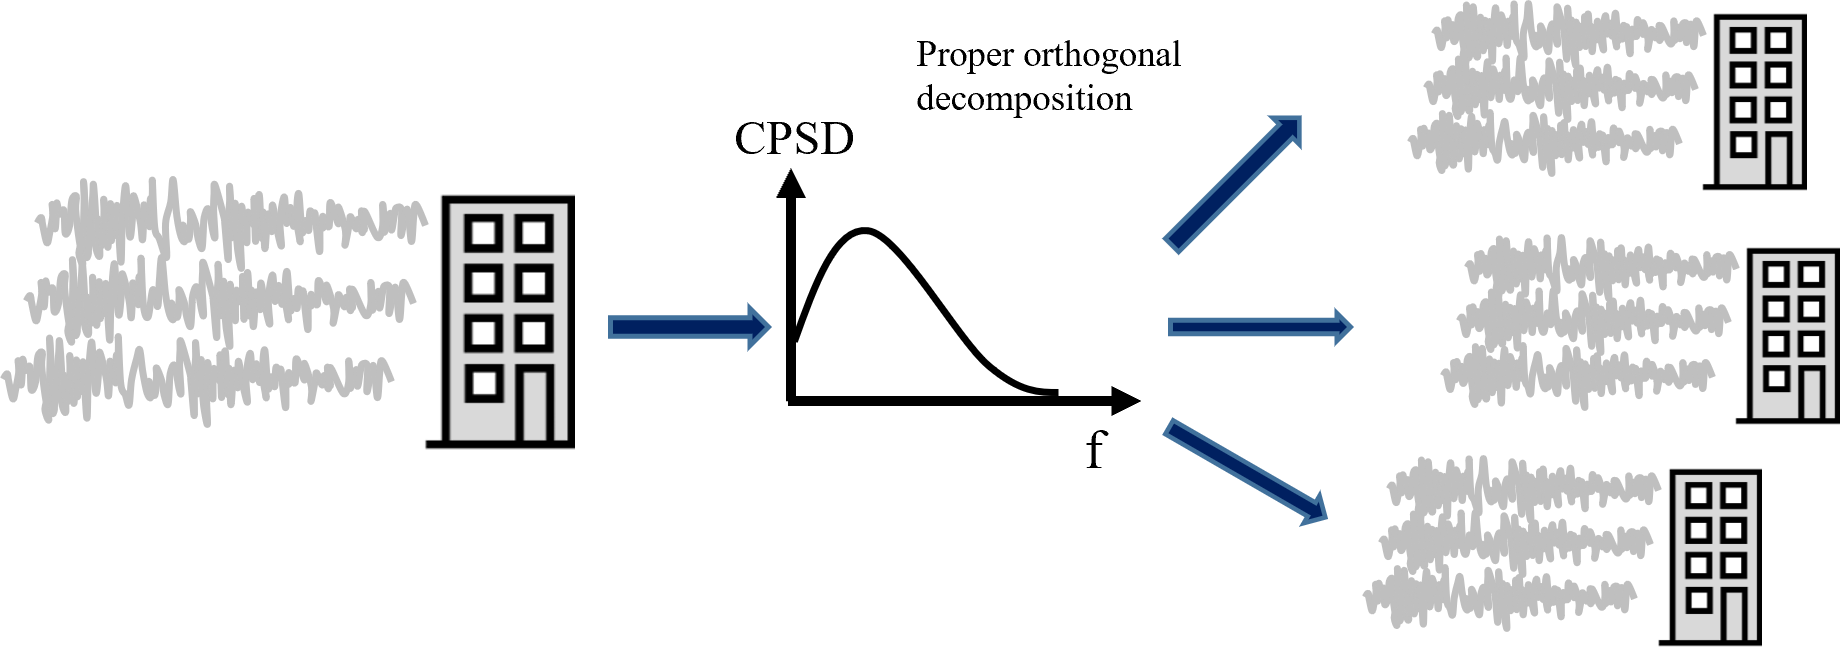
Fig. 2.4.9.1 Generating full-scale wind force history from a model-scale wind force time history obtained from wind tunnel experiments.
2.4.9.1. User Inputs

Fig. 2.4.9.1.1 Option to import experimental wind force time history
The input parameters for the application interface are provided below.
Percentage of Modes: Percentage of modes (dominant modes) that will be included to obtain the loading process. If 100% of modes are included, the simulated process is exact up to the second order, but additional computation cost is expected. It is recommended to include at least 25% of modes to have negligible errors in the simulation at a reasonable computational cost [Duarte2023]
Full Scale Reference Wind Speed: The full-scale wind speed at the reference point of the building (e.g., top of the building). The reference point location should match that of the model used in the wind tunnel testing.
Full Scale Duration: The duration of the wind force time series that will be generated by this engine.
Seed: The seed for the random number generator.
File Name: “Wind Force Time History File” that contains model geometry and wind tunnel experiment details. The data can be provided either as a MATLAB binary file (.mat) or a JSON (.json) file. Please see the next section for the details of the variables (keys) needed in the file.
Model Scale: This is the geometric length scale. This value is automatically estimated after reading the “Wind Force Time History File”, as a ratio between the full-scale and model-scale building dimensions. Only if the file is imported in a JSON format, the model scale ratio will be displayed.
The units can be modified at the GI tab.
Additional input parameters for estimating cross-power spectral density function can be specified, i.e., Window Size and Overlap Percentage. The “Window Size” is the length of the Hanning window function given in seconds. Its values can range from [0, L], where L is the record duration used as input. A window size of 4 s is suggested for wind tunnel records lasting about 30 s – 60 s, but the user has the flexibility to define this variable according to specific case study requirements. The “Overlap Percentage” determines the extent of overlap between segments of the signal. A value of 50% overlap is suggested. Note that the engine implemented in WE-UQ uses scipy.signal.csd function, and the detailed parameter information can be found in the scipy user manual.

Fig. 2.4.9.1.2 Option to import experimental wind force time history
The Full Scale Building Geometry and the Units are specified in the GI tab. The correct number of stories should also be provided.
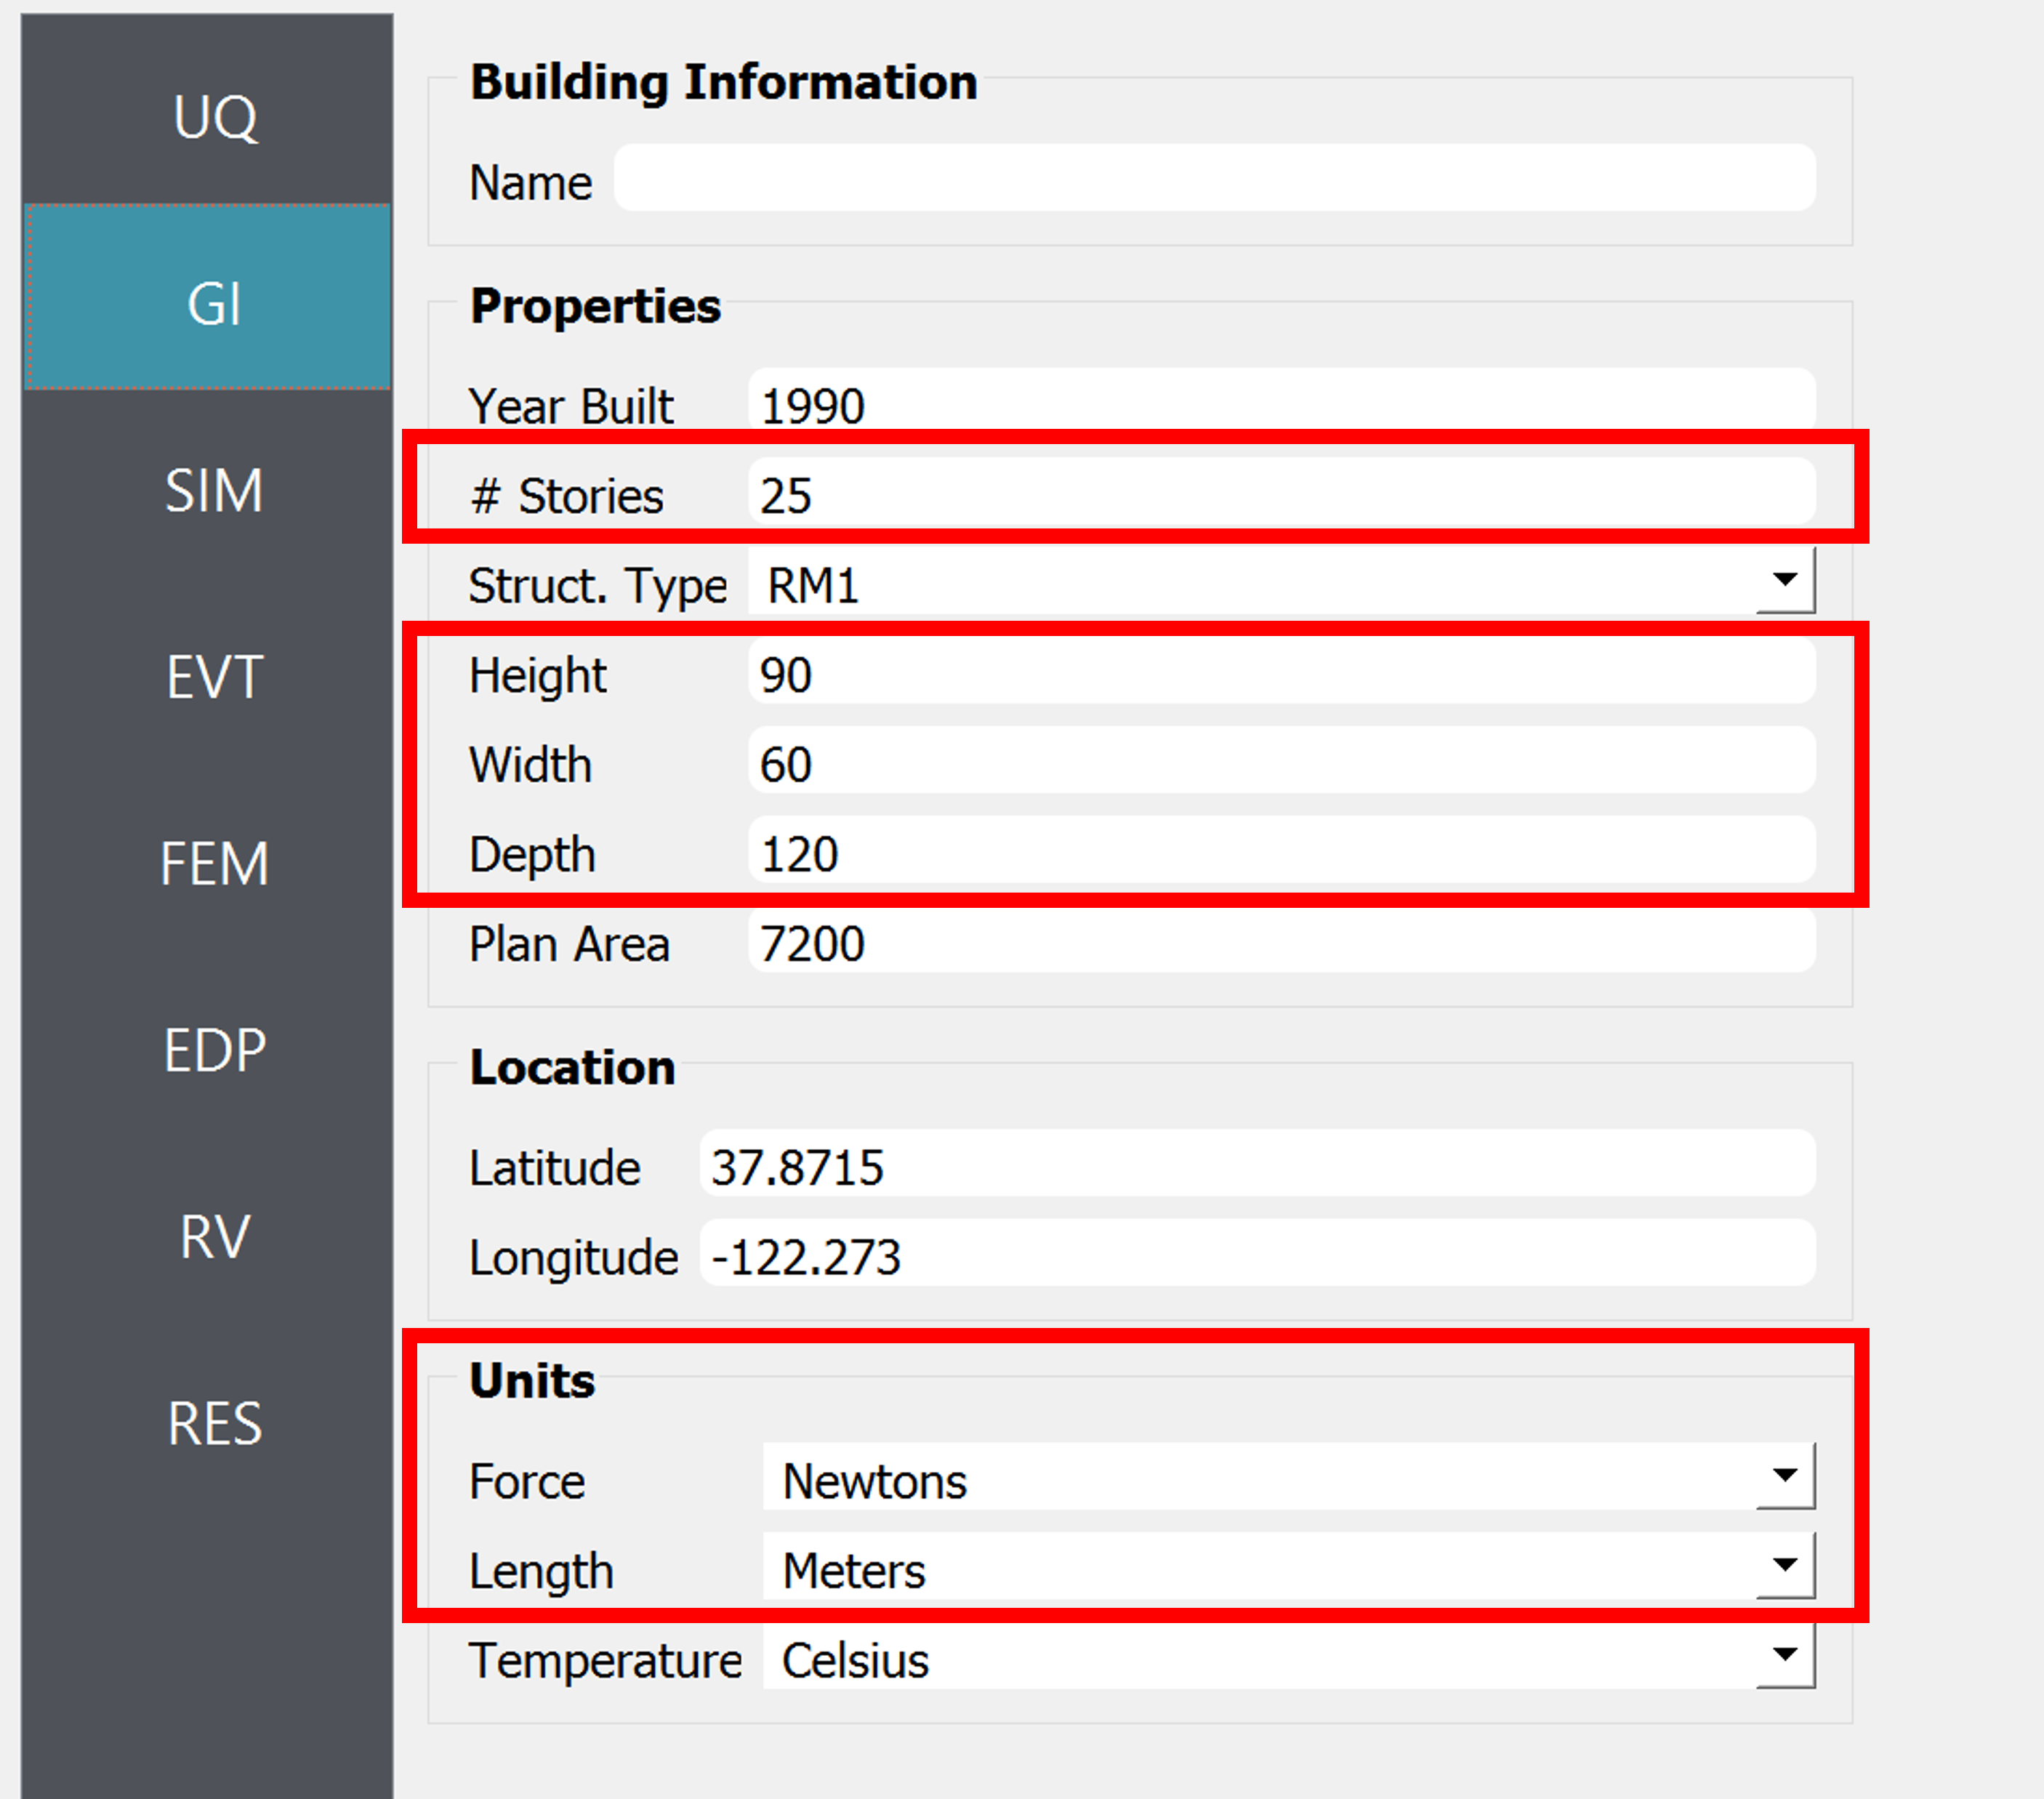
Fig. 2.4.9.1.3 GI tab (Only the variables in the red box are relevant to the current module.)
Warning
This algorithm assumes that the building is uniformly scaled in all dimensions, meaning if model height is scaled by 1/200 for the experiment, width (breath) and depth are also scaled by 1/200. Therefore the ratio of model-scale dimensions (B, H, D) provided in the “Wind Force Time History File” should match that of the full-scale dimensions (Height, Width, Depth) specified in the GI tab. Otherwise, WE-UQ will give a warning message in blue font color as shown in the screen capture above.
2.4.9.2. Wind Force Time History File
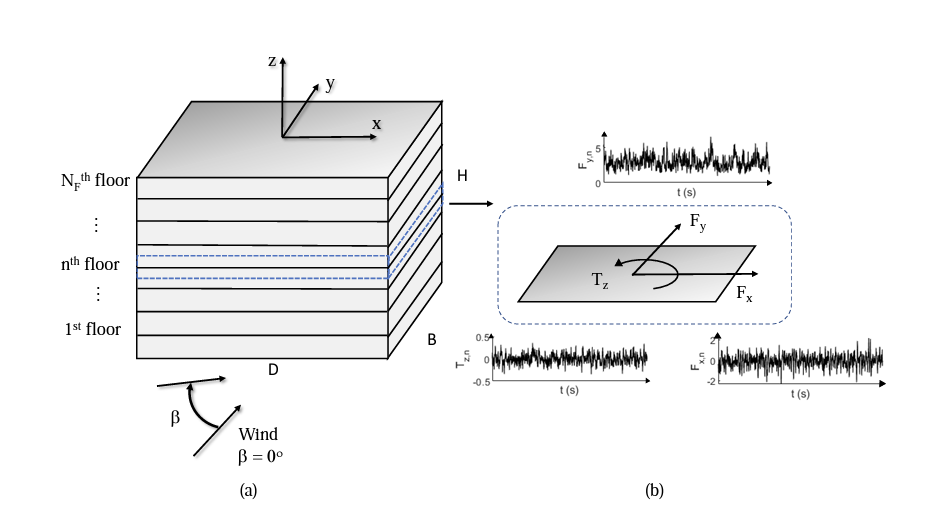
Fig. 2.4.9.2.1 Schematic representation of the building, the wind loads, and the coordinate system ([Duarte2023] )
The details of experimental wind force data should be provided either in a MATLAB binary (.mat) or JSON (.json) file. The following variables (or keys) need to be included (ntimestep: number of time steps, nfloor: number of floors of the building)
B: Scalar. Breath (Width) of the building model used in the experiment (Length unit defined in GI tab)
D: Scalar. Depth of the building model used in the experiment (Length unit defined in GI tab)
H: Scalar. Height of the building model used in the experiment (Length unit defined in GI tab)
fs: Scalar. Sampling frequency (Hz)
Fx: 2D array with size [
ntimestepxnfloor]. The x-directional wind force time history measured at each story (Force unit defined in GI tab)Fy: 2D array with size [
ntimestepxnfloor]. The y-directional wind force time history measured at each story (Force unit defined in GI tab)Tz: 2D array with size [
ntimestepxnfloor]. The z-directional wind force moment time history measured at each story (Force unit defined in GI tab)t: 1D array with size [1 x
ntimestep]. The time series data for the wind force time histories Fx, Fy, Tz (sec).Vref: Scalar. Model Scale Reference Wind Speed at the reference point of the building. The reference point of the model should match that of the full-scale building (Velocity with length unit defined in GI tab and sec).
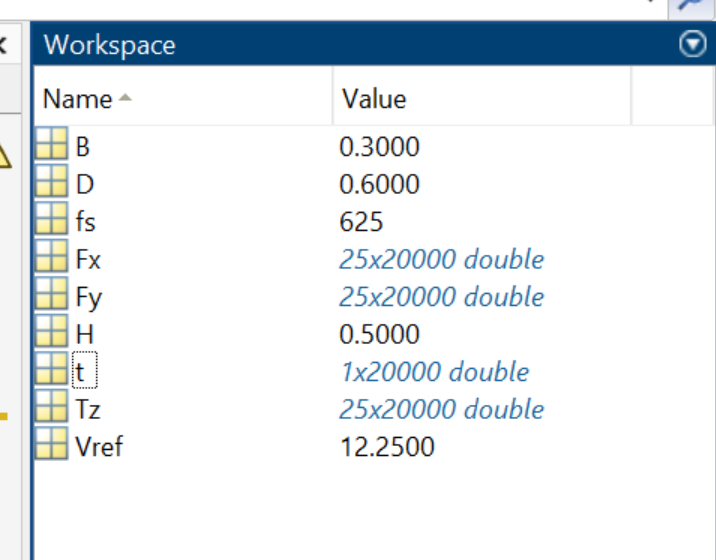
Fig. 2.4.9.2.2 Example of information inside a Matlab binary file (.mat) (nfloor = 25, ntimesteps = 20,000, units: meter, Newton, second)
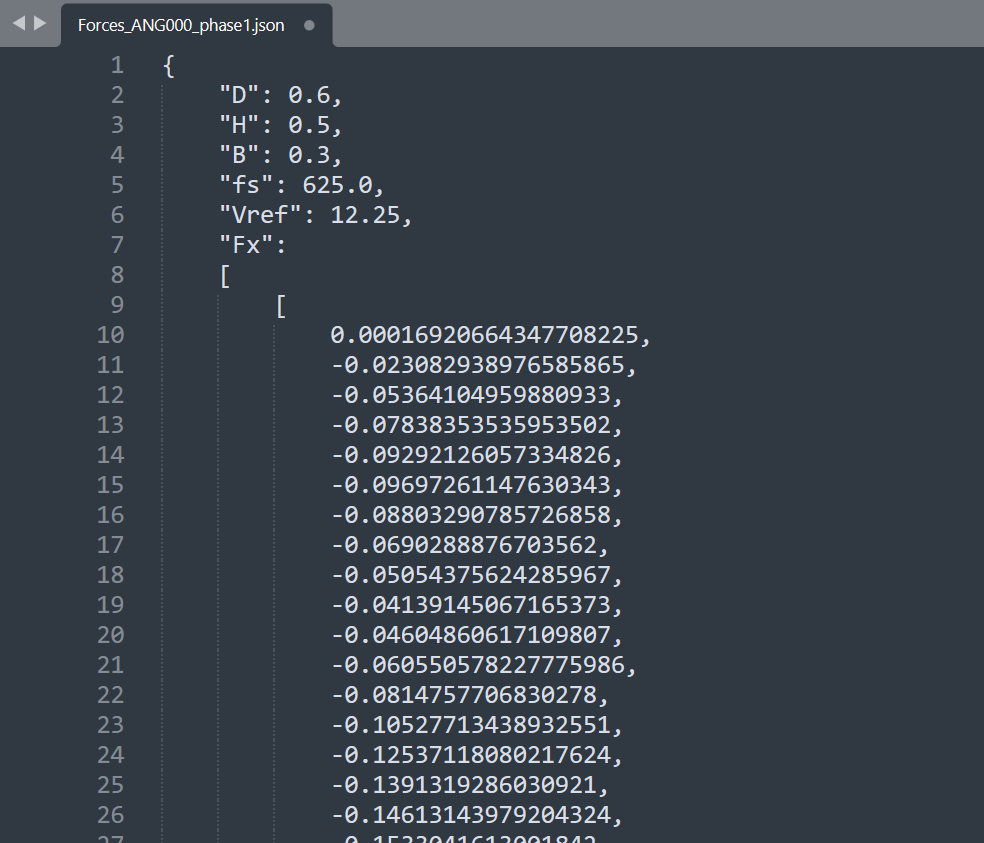
Fig. 2.4.9.2.3 Example of information inside a JSON file (.json) (nfloor = 25, ntimesteps = 20,000, units: meter, Newton, second)
The example Json file shown in the image can be found at WE-UQ/Examples/weuq-0012, named Forces_ANG000_phase1.json