Celeris
This page allows you to configure the input files, define sensors, and visualize the simulation setup for Celeris.
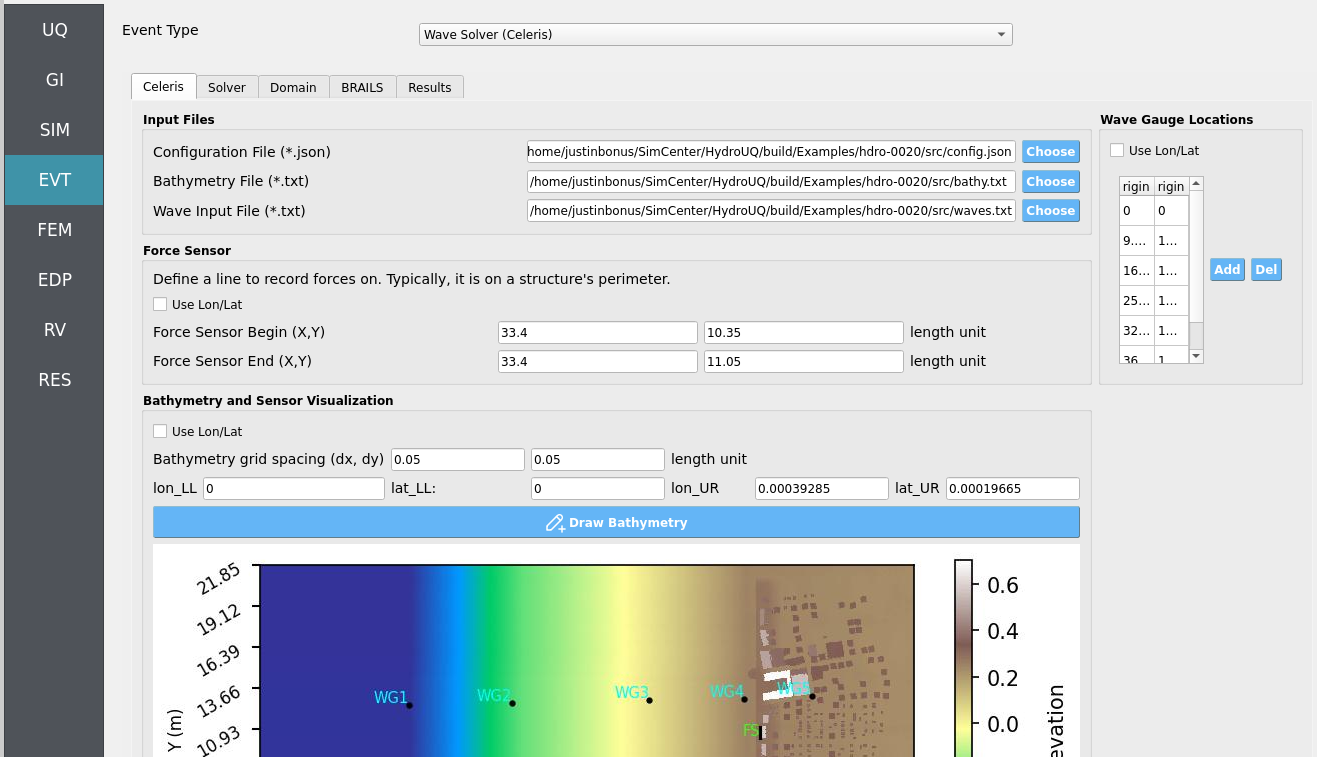
Input Files Panel
On the top-left, the Input File widget provides options to select the three essential files for a simulation:
Configuration File (JSON) — specifies Celeris simulation parameters.
Bathymetry File (TXT) — contains seafloor elevation data.
Waves File (TXT) — defines incident wave conditions.
Note
While these files are often selected manually, an alternate tab in the GUI
labeled BRAILS will automatically update them after completing its workflow.
Force Sensor Panel
The middle-left panel, Force Sensor, allows you to define a line sensor for recording hydrodynamic forces.
Define start and end points of the line.
The ordering of points matters: it affects the sensor’s normal vector calculation.
Can be defined in: - Length units (e.g., meters), or - Geographic coordinates (longitude / latitude).
Important
To capture realistic forces, place the force sensor flush with a structure’s perimeter.
Wave Gauge Locations Panel
The right-hand panel, Wave Gauge Locations, defines a list of point sensors to record the free surface elevation during the simulation.
Each row corresponds to one gauge: - Column 1 = X position - Column 2 = Y position
Gauges can be specified in either: - Length units (e.g., meters), or - Longitude / latitude.
Tip
Use multiple wave gauges to compare simulated wave records at several locations.
Bathymetry and Sensor Visualization
The bottom panel, Bathymetry and Sensor Visualization, provides a simple visualization interface.
Displays the bathymetry height map using the file selected in Input Files.
Overlays force sensors and wave gauges.
Controlled via the Draw Bathymetry button.
Note
The visualization axes can also be displayed in either length units or longitude / latitude.
Warning
Ensure that the bathymetry file is formatted correctly. An invalid file will result in failed or misleading visualizations.