|
SimCenterCommon
Common functionality used within different SimCenter projects
|
|
SimCenterCommon
Common functionality used within different SimCenter projects
|
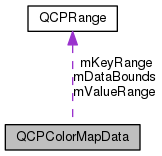
Holds the two-dimensional data of a QCPColorMap plottable. More...
#include <qcustomplot.h>
Public Member Functions | |
| QCPColorMapData (int keySize, int valueSize, const QCPRange &keyRange, const QCPRange &valueRange) | |
| ~QCPColorMapData () | |
| QCPColorMapData (const QCPColorMapData &other) | |
| QCPColorMapData & | operator= (const QCPColorMapData &other) |
| int | keySize () const |
| int | valueSize () const |
| QCPRange | keyRange () const |
| QCPRange | valueRange () const |
| QCPRange | dataBounds () const |
| double | data (double key, double value) |
| double | cell (int keyIndex, int valueIndex) |
| unsigned char | alpha (int keyIndex, int valueIndex) |
| void | setSize (int keySize, int valueSize) |
| void | setKeySize (int keySize) |
| void | setValueSize (int valueSize) |
| void | setRange (const QCPRange &keyRange, const QCPRange &valueRange) |
| void | setKeyRange (const QCPRange &keyRange) |
| void | setValueRange (const QCPRange &valueRange) |
| void | setData (double key, double value, double z) |
| void | setCell (int keyIndex, int valueIndex, double z) |
| void | setAlpha (int keyIndex, int valueIndex, unsigned char alpha) |
| void | recalculateDataBounds () |
| void | clear () |
| void | clearAlpha () |
| void | fill (double z) |
| void | fillAlpha (unsigned char alpha) |
| bool | isEmpty () const |
| void | coordToCell (double key, double value, int *keyIndex, int *valueIndex) const |
| void | cellToCoord (int keyIndex, int valueIndex, double *key, double *value) const |
Protected Member Functions | |
| bool | createAlpha (bool initializeOpaque=true) |
Protected Attributes | |
| int | mKeySize |
| int | mValueSize |
| QCPRange | mKeyRange |
| QCPRange | mValueRange |
| bool | mIsEmpty |
| double * | mData |
| unsigned char * | mAlpha |
| QCPRange | mDataBounds |
| bool | mDataModified |
Friends | |
| class | QCPColorMap |
Holds the two-dimensional data of a QCPColorMap plottable.
This class is a data storage for QCPColorMap. It holds a two-dimensional array, which QCPColorMap then displays as a 2D image in the plot, where the array values are represented by a color, depending on the value.
The size of the array can be controlled via setSize (or setKeySize, setValueSize). Which plot coordinates these cells correspond to can be configured with setRange (or setKeyRange, setValueRange).
The data cells can be accessed in two ways: They can be directly addressed by an integer index with setCell. This is the fastest method. Alternatively, they can be addressed by their plot coordinate with setData. plot coordinate to cell index transformations and vice versa are provided by the functions coordToCell and cellToCoord.
A QCPColorMapData also holds an on-demand two-dimensional array of alpha values which (if allocated) has the same size as the data map. It can be accessed via setAlpha, fillAlpha and clearAlpha. The memory for the alpha map is only allocated if needed, i.e. on the first call of setAlpha. clearAlpha restores full opacity and frees the alpha map.
This class also buffers the minimum and maximum values that are in the data set, to provide QCPColorMap::rescaleDataRange with the necessary information quickly. Setting a cell to a value that is greater than the current maximum increases this maximum to the new value. However, setting the cell that currently holds the maximum value to a smaller value doesn't decrease the maximum again, because finding the true new maximum would require going through the entire data array, which might be time consuming. The same holds for the data minimum. This functionality is given by recalculateDataBounds, such that you can decide when it is sensible to find the true current minimum and maximum. The method QCPColorMap::rescaleDataRange offers a convenience parameter recalculateDataBounds which may be set to true to automatically call recalculateDataBounds internally.
Definition at line 5646 of file qcustomplot.h.
| QCPColorMapData::QCPColorMapData | ( | int | keySize, |
| int | valueSize, | ||
| const QCPRange & | keyRange, | ||
| const QCPRange & | valueRange | ||
| ) |
Constructs a new QCPColorMapData instance. The instance has keySize cells in the key direction and valueSize cells in the value direction. These cells will be displayed by the QCPColorMap at the coordinates keyRange and valueRange.
Definition at line 24627 of file qcustomplot.cpp.
| QCPColorMapData::~QCPColorMapData | ( | ) |
Definition at line 24641 of file qcustomplot.cpp.
| QCPColorMapData::QCPColorMapData | ( | const QCPColorMapData & | other | ) |
Constructs a new QCPColorMapData instance copying the data and range of other.
Definition at line 24652 of file qcustomplot.cpp.
Returns the alpha map value of the cell with the indices keyIndex and valueIndex.
If this color map data doesn't have an alpha map (because setAlpha was never called after creation or after a call to clearAlpha), returns 255, which corresponds to full opacity.
Definition at line 24719 of file qcustomplot.cpp.
Definition at line 24703 of file qcustomplot.cpp.
| void QCPColorMapData::cellToCoord | ( | int | keyIndex, |
| int | valueIndex, | ||
| double * | key, | ||
| double * | value | ||
| ) | const |
Transforms cell indices given by keyIndex and valueIndex to cell indices of this QCPColorMapData instance. The resulting coordinates are returned via the output parameters key and value.
If you are only interested in a key or value coordinate, you may pass 0 as key or value.
Definition at line 25054 of file qcustomplot.cpp.
| void QCPColorMapData::clear | ( | void | ) |
Frees the internal data memory.
This is equivalent to calling setSize(0, 0).
Definition at line 24964 of file qcustomplot.cpp.
| void QCPColorMapData::clearAlpha | ( | ) |
Frees the internal alpha map. The color map will have full opacity again.
Definition at line 24972 of file qcustomplot.cpp.
| void QCPColorMapData::coordToCell | ( | double | key, |
| double | value, | ||
| int * | keyIndex, | ||
| int * | valueIndex | ||
| ) | const |
Transforms plot coordinates given by key and value to cell indices of this QCPColorMapData instance. The resulting cell indices are returned via the output parameters keyIndex and valueIndex.
The retrieved key/value cell indices can then be used for example with setCell.
If you are only interested in a key or value index, you may pass 0 as valueIndex or keyIndex.
Definition at line 25031 of file qcustomplot.cpp.
|
protected |
Definition at line 25075 of file qcustomplot.cpp.
| double QCPColorMapData::data | ( | double | key, |
| double | value | ||
| ) |
Definition at line 24692 of file qcustomplot.cpp.
|
inline |
Definition at line 5659 of file qcustomplot.h.
| void QCPColorMapData::fill | ( | double | z | ) |
Sets all cells to the value z.
Definition at line 24985 of file qcustomplot.cpp.
| void QCPColorMapData::fillAlpha | ( | unsigned char | alpha | ) |
Sets the opacity of all color map cells to alpha. A value of 0 for alpha results in a fully transparent color map, and a value of 255 results in a fully opaque color map.
If you wish to restore opacity to 100% and free any used memory for the alpha map, rather use clearAlpha.
Definition at line 25003 of file qcustomplot.cpp.
|
inline |
Returns whether this instance carries no data. This is equivalent to having a size where at least one of the dimensions is 0 (see setSize).
Definition at line 5681 of file qcustomplot.h.
|
inline |
Definition at line 5657 of file qcustomplot.h.
|
inline |
Definition at line 5655 of file qcustomplot.h.
| QCPColorMapData & QCPColorMapData::operator= | ( | const QCPColorMapData & | other | ) |
Overwrites this color map data instance with the data stored in other. The alpha map state is transferred, too.
Definition at line 24667 of file qcustomplot.cpp.
| void QCPColorMapData::recalculateDataBounds | ( | ) |
Goes through the data and updates the buffered minimum and maximum data values.
Calling this method is only advised if you are about to call QCPColorMap::rescaleDataRange and can not guarantee that the cells holding the maximum or minimum data haven't been overwritten with a smaller or larger value respectively, since the buffered maximum/minimum values have been updated the last time. Why this is the case is explained in the class description (QCPColorMapData).
Note that the method QCPColorMap::rescaleDataRange provides a parameter recalculateDataBounds for convenience. Setting this to true will call this method for you, before doing the rescale.
Definition at line 24940 of file qcustomplot.cpp.
Sets the alpha of the color map cell given by keyIndex and valueIndex to alpha. A value of 0 for alpha results in a fully transparent cell, and a value of 255 results in a fully opaque cell.
If an alpha map doesn't exist yet for this color map data, it will be created here. If you wish to restore full opacity and free any allocated memory of the alpha map, call clearAlpha.
Note that the cell-wise alpha which can be configured here is independent of any alpha configured in the color map's gradient (QCPColorGradient). If a cell is affected both by the cell-wise and gradient alpha, the alpha values will be blended accordingly during rendering of the color map.
Definition at line 24914 of file qcustomplot.cpp.
Sets the data of the cell with indices keyIndex and valueIndex to z. The indices enumerate the cells starting from zero, up to the map's size-1 in the respective dimension (see setSize).
In the standard plot configuration (horizontal key axis and vertical value axis, both not range-reversed), the cell with indices (0, 0) is in the bottom left corner and the cell with indices (keySize-1, valueSize-1) is in the top right corner of the color map.
Definition at line 24885 of file qcustomplot.cpp.
| void QCPColorMapData::setData | ( | double | key, |
| double | value, | ||
| double | z | ||
| ) |
Sets the data of the cell, which lies at the plot coordinates given by key and value, to z.
Definition at line 24859 of file qcustomplot.cpp.
| void QCPColorMapData::setKeyRange | ( | const QCPRange & | keyRange | ) |
Sets the coordinate range the data shall be distributed over in the key dimension. Together with the value range, This defines the rectangular area covered by the color map in plot coordinates.
The outer cells will be centered on the range boundaries given to this function. For example, if the key size (setKeySize) is 3 and keyRange is set to QCPRange(2, 3) there will be cells centered on the key coordinates 2, 2.5 and 3.
Definition at line 24827 of file qcustomplot.cpp.
| void QCPColorMapData::setKeySize | ( | int | keySize | ) |
Resizes the data array to have keySize cells in the key dimension.
The current data is discarded and the map cells are set to 0, unless the map had already the requested size.
Setting keySize to zero frees the internal data array and isEmpty returns true.
Definition at line 24781 of file qcustomplot.cpp.
Sets the coordinate ranges the data shall be distributed over. This defines the rectangular area covered by the color map in plot coordinates.
The outer cells will be centered on the range boundaries given to this function. For example, if the key size (setKeySize) is 3 and keyRange is set to QCPRange(2, 3) there will be cells centered on the key coordinates 2, 2.5 and 3.
Definition at line 24811 of file qcustomplot.cpp.
Resizes the data array to have keySize cells in the key dimension and valueSize cells in the value dimension.
The current data is discarded and the map cells are set to 0, unless the map had already the requested size.
Setting at least one of keySize or valueSize to zero frees the internal data array and isEmpty returns true.
Definition at line 24739 of file qcustomplot.cpp.
| void QCPColorMapData::setValueRange | ( | const QCPRange & | valueRange | ) |
Sets the coordinate range the data shall be distributed over in the value dimension. Together with the key range, This defines the rectangular area covered by the color map in plot coordinates.
The outer cells will be centered on the range boundaries given to this function. For example, if the value size (setValueSize) is 3 and valueRange is set to QCPRange(2, 3) there will be cells centered on the value coordinates 2, 2.5 and 3.
Definition at line 24842 of file qcustomplot.cpp.
| void QCPColorMapData::setValueSize | ( | int | valueSize | ) |
Resizes the data array to have valueSize cells in the value dimension.
The current data is discarded and the map cells are set to 0, unless the map had already the requested size.
Setting valueSize to zero frees the internal data array and isEmpty returns true.
Definition at line 24796 of file qcustomplot.cpp.
|
inline |
Definition at line 5658 of file qcustomplot.h.
|
inline |
Definition at line 5656 of file qcustomplot.h.
|
friend |
Definition at line 5699 of file qcustomplot.h.
|
protected |
Definition at line 5693 of file qcustomplot.h.
|
protected |
Definition at line 5692 of file qcustomplot.h.
|
protected |
Definition at line 5694 of file qcustomplot.h.
|
protected |
Definition at line 5695 of file qcustomplot.h.
|
protected |
Definition at line 5689 of file qcustomplot.h.
|
protected |
Definition at line 5688 of file qcustomplot.h.
|
protected |
Definition at line 5687 of file qcustomplot.h.
|
protected |
Definition at line 5688 of file qcustomplot.h.
|
protected |
Definition at line 5687 of file qcustomplot.h.
 1.8.11
