|
SimCenterCommon
Common functionality used within different SimCenter projects
|
|
SimCenterCommon
Common functionality used within different SimCenter projects
|
A plottable representing a two-dimensional color map in a plot. More...
#include <qcustomplot.h>
Signals | |
| void | dataRangeChanged (const QCPRange &newRange) |
| void | dataScaleTypeChanged (QCPAxis::ScaleType scaleType) |
| void | gradientChanged (const QCPColorGradient &newGradient) |
 Signals inherited from QCPAbstractPlottable Signals inherited from QCPAbstractPlottable | |
| void | selectionChanged (bool selected) |
| void | selectionChanged (const QCPDataSelection &selection) |
| void | selectableChanged (QCP::SelectionType selectable) |
| Signals inherited from QCPLayerable | |
| void | layerChanged (QCPLayer *newLayer) |
Public Member Functions | |
| QCPColorMap (QCPAxis *keyAxis, QCPAxis *valueAxis) | |
| virtual | ~QCPColorMap () |
| QCPColorMapData * | data () const |
| QCPRange | dataRange () const |
| QCPAxis::ScaleType | dataScaleType () const |
| bool | interpolate () const |
| bool | tightBoundary () const |
| QCPColorGradient | gradient () const |
| QCPColorScale * | colorScale () const |
| void | setData (QCPColorMapData *data, bool copy=false) |
| Q_SLOT void | setDataRange (const QCPRange &dataRange) |
| Q_SLOT void | setDataScaleType (QCPAxis::ScaleType scaleType) |
| Q_SLOT void | setGradient (const QCPColorGradient &gradient) |
| void | setInterpolate (bool enabled) |
| void | setTightBoundary (bool enabled) |
| void | setColorScale (QCPColorScale *colorScale) |
| void | rescaleDataRange (bool recalculateDataBounds=false) |
| Q_SLOT void | updateLegendIcon (Qt::TransformationMode transformMode=Qt::SmoothTransformation, const QSize &thumbSize=QSize(32, 18)) |
| virtual double | selectTest (const QPointF &pos, bool onlySelectable, QVariant *details=0) const Q_DECL_OVERRIDE |
| virtual QCPRange | getKeyRange (bool &foundRange, QCP::SignDomain inSignDomain=QCP::sdBoth) const Q_DECL_OVERRIDE |
| virtual QCPRange | getValueRange (bool &foundRange, QCP::SignDomain inSignDomain=QCP::sdBoth, const QCPRange &inKeyRange=QCPRange()) const Q_DECL_OVERRIDE |
| Public Member Functions inherited from QCPAbstractPlottable | |
| QCPAbstractPlottable (QCPAxis *keyAxis, QCPAxis *valueAxis) | |
| virtual | ~QCPAbstractPlottable () |
| QString | name () const |
| bool | antialiasedFill () const |
| bool | antialiasedScatters () const |
| QPen | pen () const |
| QBrush | brush () const |
| QCPAxis * | keyAxis () const |
| QCPAxis * | valueAxis () const |
| QCP::SelectionType | selectable () const |
| bool | selected () const |
| QCPDataSelection | selection () const |
| QCPSelectionDecorator * | selectionDecorator () const |
| void | setName (const QString &name) |
| void | setAntialiasedFill (bool enabled) |
| void | setAntialiasedScatters (bool enabled) |
| void | setPen (const QPen &pen) |
| void | setBrush (const QBrush &brush) |
| void | setKeyAxis (QCPAxis *axis) |
| void | setValueAxis (QCPAxis *axis) |
| Q_SLOT void | setSelectable (QCP::SelectionType selectable) |
| Q_SLOT void | setSelection (QCPDataSelection selection) |
| void | setSelectionDecorator (QCPSelectionDecorator *decorator) |
| virtual QCPPlottableInterface1D * | interface1D () |
| void | coordsToPixels (double key, double value, double &x, double &y) const |
| const QPointF | coordsToPixels (double key, double value) const |
| void | pixelsToCoords (double x, double y, double &key, double &value) const |
| void | pixelsToCoords (const QPointF &pixelPos, double &key, double &value) const |
| void | rescaleAxes (bool onlyEnlarge=false) const |
| void | rescaleKeyAxis (bool onlyEnlarge=false) const |
| void | rescaleValueAxis (bool onlyEnlarge=false, bool inKeyRange=false) const |
| bool | addToLegend (QCPLegend *legend) |
| bool | addToLegend () |
| bool | removeFromLegend (QCPLegend *legend) const |
| bool | removeFromLegend () const |
| Public Member Functions inherited from QCPLayerable | |
| QCPLayerable (QCustomPlot *plot, QString targetLayer=QString(), QCPLayerable *parentLayerable=0) | |
| virtual | ~QCPLayerable () |
| bool | visible () const |
| QCustomPlot * | parentPlot () const |
| QCPLayerable * | parentLayerable () const |
| QCPLayer * | layer () const |
| bool | antialiased () const |
| void | setVisible (bool on) |
| Q_SLOT bool | setLayer (QCPLayer *layer) |
| bool | setLayer (const QString &layerName) |
| void | setAntialiased (bool enabled) |
| bool | realVisibility () const |
Protected Member Functions | |
| virtual void | updateMapImage () |
| virtual void | draw (QCPPainter *painter) Q_DECL_OVERRIDE |
| virtual void | drawLegendIcon (QCPPainter *painter, const QRectF &rect) const Q_DECL_OVERRIDE |
| Protected Member Functions inherited from QCPAbstractPlottable | |
| virtual QRect | clipRect () const Q_DECL_OVERRIDE |
| virtual QCP::Interaction | selectionCategory () const Q_DECL_OVERRIDE |
| void | applyDefaultAntialiasingHint (QCPPainter *painter) const Q_DECL_OVERRIDE |
| virtual void | selectEvent (QMouseEvent *event, bool additive, const QVariant &details, bool *selectionStateChanged) Q_DECL_OVERRIDE |
| virtual void | deselectEvent (bool *selectionStateChanged) Q_DECL_OVERRIDE |
| void | applyFillAntialiasingHint (QCPPainter *painter) const |
| void | applyScattersAntialiasingHint (QCPPainter *painter) const |
| Protected Member Functions inherited from QCPLayerable | |
| virtual void | parentPlotInitialized (QCustomPlot *parentPlot) |
| virtual void | mousePressEvent (QMouseEvent *event, const QVariant &details) |
| virtual void | mouseMoveEvent (QMouseEvent *event, const QPointF &startPos) |
| virtual void | mouseReleaseEvent (QMouseEvent *event, const QPointF &startPos) |
| virtual void | mouseDoubleClickEvent (QMouseEvent *event, const QVariant &details) |
| virtual void | wheelEvent (QWheelEvent *event) |
| void | initializeParentPlot (QCustomPlot *parentPlot) |
| void | setParentLayerable (QCPLayerable *parentLayerable) |
| bool | moveToLayer (QCPLayer *layer, bool prepend) |
| void | applyAntialiasingHint (QCPPainter *painter, bool localAntialiased, QCP::AntialiasedElement overrideElement) const |
Protected Attributes | |
| QCPRange | mDataRange |
| QCPAxis::ScaleType | mDataScaleType |
| QCPColorMapData * | mMapData |
| QCPColorGradient | mGradient |
| bool | mInterpolate |
| bool | mTightBoundary |
| QPointer< QCPColorScale > | mColorScale |
| QImage | mMapImage |
| QImage | mUndersampledMapImage |
| QPixmap | mLegendIcon |
| bool | mMapImageInvalidated |
| Protected Attributes inherited from QCPAbstractPlottable | |
| QString | mName |
| bool | mAntialiasedFill |
| bool | mAntialiasedScatters |
| QPen | mPen |
| QBrush | mBrush |
| QPointer< QCPAxis > | mKeyAxis |
| QPointer< QCPAxis > | mValueAxis |
| QCP::SelectionType | mSelectable |
| QCPDataSelection | mSelection |
| QCPSelectionDecorator * | mSelectionDecorator |
| Protected Attributes inherited from QCPLayerable | |
| bool | mVisible |
| QCustomPlot * | mParentPlot |
| QPointer< QCPLayerable > | mParentLayerable |
| QCPLayer * | mLayer |
| bool | mAntialiased |
Friends | |
| class | QCustomPlot |
| class | QCPLegend |
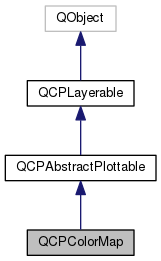
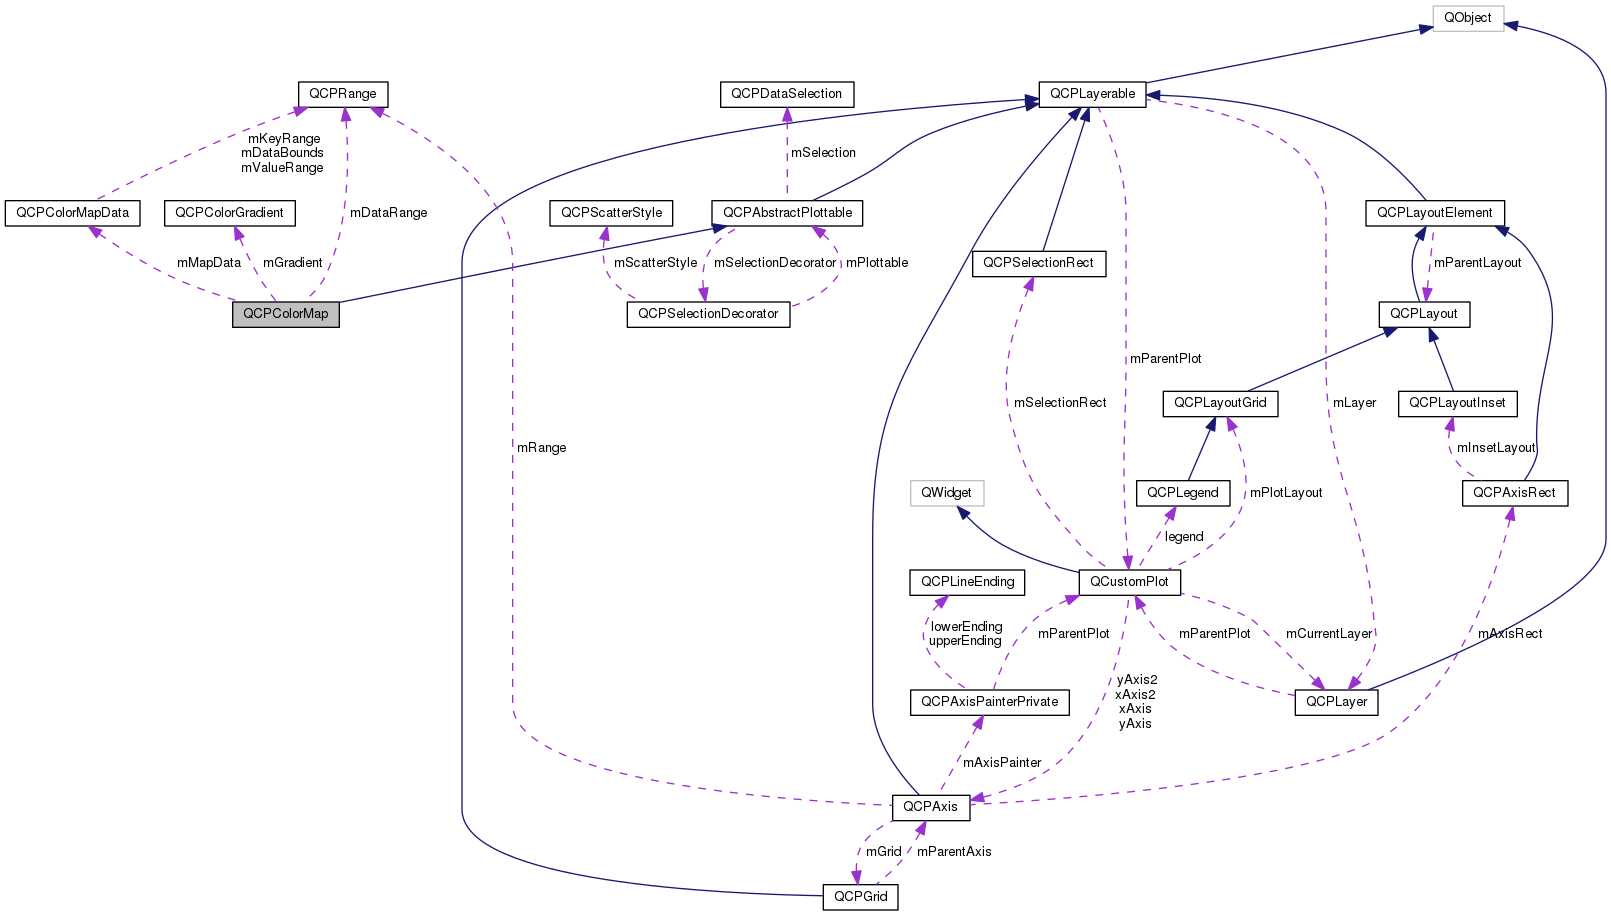
A plottable representing a two-dimensional color map in a plot.

The data is stored in the class QCPColorMapData, which can be accessed via the data() method.
A color map has three dimensions to represent a data point: The key dimension, the value dimension and the data dimension. As with other plottables such as graphs, key and value correspond to two orthogonal axes on the QCustomPlot surface that you specify in the QCPColorMap constructor. The data dimension however is encoded as the color of the point at (key, value).
Set the number of points (or cells) in the key/value dimension via QCPColorMapData::setSize. The plot coordinate range over which these points will be displayed is specified via QCPColorMapData::setRange. The first cell will be centered on the lower range boundary and the last cell will be centered on the upper range boundary. The data can be set by either accessing the cells directly with QCPColorMapData::setCell or by addressing the cells via their plot coordinates with QCPColorMapData::setData. If possible, you should prefer setCell, since it doesn't need to do any coordinate transformation and thus performs a bit better.
The cell with index (0, 0) is at the bottom left, if the color map uses normal (i.e. not reversed) key and value axes.
To show the user which colors correspond to which data values, a QCPColorScale is typically placed to the right of the axis rect. See the documentation there for details on how to add and use a color scale.
The central part of the appearance is the color gradient, which can be specified via setGradient. See the documentation of QCPColorGradient for details on configuring a color gradient.
The data range that is mapped to the colors of the gradient can be specified with setDataRange. To make the data range encompass the whole data set minimum to maximum, call rescaleDataRange.
Transparency in color maps can be achieved by two mechanisms. On one hand, you can specify alpha values for color stops of the QCPColorGradient, via the regular QColor interface. This will cause the color map data which gets mapped to colors around those color stops to appear with the accordingly interpolated transparency.
On the other hand you can also directly apply an alpha value to each cell independent of its data, by using the alpha map feature of QCPColorMapData. The relevant methods are QCPColorMapData::setAlpha, QCPColorMapData::fillAlpha and QCPColorMapData::clearAlpha().
The two transparencies will be joined together in the plot and otherwise not interfere with each other. They are mixed in a multiplicative matter, so an alpha of e.g. 50% (128/255) in both modes simultaneously, will result in a total transparency of 25% (64/255).
Like all data representing objects in QCustomPlot, the QCPColorMap is a plottable (QCPAbstractPlottable). So the plottable-interface of QCustomPlot applies (QCustomPlot::plottable, QCustomPlot::removePlottable, etc.)
Usually, you first create an instance:
which registers it with the QCustomPlot instance of the passed axes. Note that this QCustomPlot instance takes ownership of the plottable, so do not delete it manually but use QCustomPlot::removePlottable() instead. The newly created plottable can be modified, e.g.:
Definition at line 5703 of file qcustomplot.h.
Constructs a color map with the specified keyAxis and valueAxis.
The created QCPColorMap is automatically registered with the QCustomPlot instance inferred from keyAxis. This QCustomPlot instance takes ownership of the QCPColorMap, so do not delete it manually but use QCustomPlot::removePlottable() instead.
Definition at line 25224 of file qcustomplot.cpp.
|
virtual |
Definition at line 25234 of file qcustomplot.cpp.
|
inline |
Definition at line 5725 of file qcustomplot.h.
|
inline |
Returns a pointer to the internal data storage of type QCPColorMapData. Access this to modify data points (cells) and the color map key/value range.
Definition at line 5719 of file qcustomplot.h.
|
inline |
Definition at line 5720 of file qcustomplot.h.
|
signal |
This signal is emitted when the data range changes.
|
inline |
Definition at line 5721 of file qcustomplot.h.
|
signal |
This signal is emitted when the data scale type changes.
|
protectedvirtual |
Implements QCPAbstractPlottable.
Definition at line 25606 of file qcustomplot.cpp.
|
protectedvirtual |
Implements QCPAbstractPlottable.
Definition at line 25675 of file qcustomplot.cpp.
|
virtual |
Returns the coordinate range that all data in this plottable span in the key axis dimension. For logarithmic plots, one can set inSignDomain to either QCP::sdNegative or QCP::sdPositive in order to restrict the returned range to that sign domain. E.g. when only negative range is wanted, set inSignDomain to QCP::sdNegative and all positive points will be ignored for range calculation. For no restriction, just set inSignDomain to QCP::sdBoth (default). foundRange is an output parameter that indicates whether a range could be found or not. If this is false, you shouldn't use the returned range (e.g. no points in data).
Note that foundRange is not the same as QCPRange::validRange, since the range returned by this function may have size zero (e.g. when there is only one data point). In this case foundRange would return true, but the returned range is not a valid range in terms of QCPRange::validRange.
Implements QCPAbstractPlottable.
Definition at line 25470 of file qcustomplot.cpp.
|
virtual |
Returns the coordinate range that the data points in the specified key range (inKeyRange) span in the value axis dimension. For logarithmic plots, one can set inSignDomain to either QCP::sdNegative or QCP::sdPositive in order to restrict the returned range to that sign domain. E.g. when only negative range is wanted, set inSignDomain to QCP::sdNegative and all positive points will be ignored for range calculation. For no restriction, just set inSignDomain to QCP::sdBoth (default). foundRange is an output parameter that indicates whether a range could be found or not. If this is false, you shouldn't use the returned range (e.g. no points in data).
If inKeyRange has both lower and upper bound set to zero (is equal to QCPRange()), all data points are considered, without any restriction on the keys.
Note that foundRange is not the same as QCPRange::validRange, since the range returned by this function may have size zero (e.g. when there is only one data point). In this case foundRange would return true, but the returned range is not a valid range in terms of QCPRange::validRange.
Implements QCPAbstractPlottable.
Definition at line 25492 of file qcustomplot.cpp.
|
inline |
Definition at line 5724 of file qcustomplot.h.
|
signal |
This signal is emitted when the gradient changes.
|
inline |
Definition at line 5722 of file qcustomplot.h.
| void QCPColorMap::rescaleDataRange | ( | bool | recalculateDataBounds = false | ) |
Sets the data range (setDataRange) to span the minimum and maximum values that occur in the current data set. This corresponds to the rescaleKeyAxis or rescaleValueAxis methods, only for the third data dimension of the color map.
The minimum and maximum values of the data set are buffered in the internal QCPColorMapData instance (data). As data is updated via its QCPColorMapData::setCell or QCPColorMapData::setData, the buffered minimum and maximum values are updated, too. For performance reasons, however, they are only updated in an expanding fashion. So the buffered maximum can only increase and the buffered minimum can only decrease. In consequence, changes to the data that actually lower the maximum of the data set (by overwriting the cell holding the current maximum with a smaller value), aren't recognized and the buffered maximum overestimates the true maximum of the data set. The same happens for the buffered minimum. To recalculate the true minimum and maximum by explicitly looking at each cell, the method QCPColorMapData::recalculateDataBounds can be used. For convenience, setting the parameter recalculateDataBounds calls this method before setting the data range to the buffered minimum and maximum.
Definition at line 25412 of file qcustomplot.cpp.
|
virtual |
This function is used to decide whether a click hits a layerable object or not.
pos is a point in pixel coordinates on the QCustomPlot surface. This function returns the shortest pixel distance of this point to the object. If the object is either invisible or the distance couldn't be determined, -1.0 is returned. Further, if onlySelectable is true and the object is not selectable, -1.0 is returned, too.
If the object is represented not by single lines but by an area like a QCPItemText or the bars of a QCPBars plottable, a click inside the area should also be considered a hit. In these cases this function thus returns a constant value greater zero but still below the parent plot's selection tolerance. (typically the selectionTolerance multiplied by 0.99).
Providing a constant value for area objects allows selecting line objects even when they are obscured by such area objects, by clicking close to the lines (i.e. closer than 0.99*selectionTolerance).
The actual setting of the selection state is not done by this function. This is handled by the parent QCustomPlot when the mouseReleaseEvent occurs, and the finally selected object is notified via the selectEvent/deselectEvent methods.
details is an optional output parameter. Every layerable subclass may place any information in details. This information will be passed to selectEvent when the parent QCustomPlot decides on the basis of this selectTest call, that the object was successfully selected. The subsequent call to selectEvent will carry the details. This is useful for multi-part objects (like QCPAxis). This way, a possibly complex calculation to decide which part was clicked is only done once in selectTest. The result (i.e. the actually clicked part) can then be placed in details. So in the subsequent selectEvent, the decision which part was selected doesn't have to be done a second time for a single selection operation.
You may pass 0 as details to indicate that you are not interested in those selection details.
Implements QCPAbstractPlottable.
Definition at line 25447 of file qcustomplot.cpp.
| void QCPColorMap::setColorScale | ( | QCPColorScale * | colorScale | ) |
Associates the color scale colorScale with this color map.
This means that both the color scale and the color map synchronize their gradient, data range and data scale type (setGradient, setDataRange, setDataScaleType). Multiple color maps can be associated with one single color scale. This causes the color maps to also synchronize those properties, via the mutual color scale.
This function causes the color map to adopt the current color gradient, data range and data scale type of colorScale. After this call, you may change these properties at either the color map or the color scale, and the setting will be applied to both.
Pass 0 as colorScale to disconnect the color scale from this color map again.
Definition at line 25366 of file qcustomplot.cpp.
| void QCPColorMap::setData | ( | QCPColorMapData * | data, |
| bool | copy = false |
||
| ) |
Replaces the current data with the provided data.
If copy is set to true, the data object will only be copied. if false, the color map takes ownership of the passed data and replaces the internal data pointer with it. This is significantly faster than copying for large datasets.
Definition at line 25246 of file qcustomplot.cpp.
| void QCPColorMap::setDataRange | ( | const QCPRange & | dataRange | ) |
Sets the data range of this color map to dataRange. The data range defines which data values are mapped to the color gradient.
To make the data range span the full range of the data set, use rescaleDataRange.
Definition at line 25272 of file qcustomplot.cpp.
| void QCPColorMap::setDataScaleType | ( | QCPAxis::ScaleType | scaleType | ) |
Sets whether the data is correlated with the color gradient linearly or logarithmically.
Definition at line 25291 of file qcustomplot.cpp.
| void QCPColorMap::setGradient | ( | const QCPColorGradient & | gradient | ) |
Sets the color gradient that is used to represent the data. For more details on how to create an own gradient or use one of the preset gradients, see QCPColorGradient.
The colors defined by the gradient will be used to represent data values in the currently set data range, see setDataRange. Data points that are outside this data range will either be colored uniformly with the respective gradient boundary color, or the gradient will repeat, depending on QCPColorGradient::setPeriodic.
Definition at line 25314 of file qcustomplot.cpp.
| void QCPColorMap::setInterpolate | ( | bool | enabled | ) |
Sets whether the color map image shall use bicubic interpolation when displaying the color map shrinked or expanded, and not at a 1:1 pixel-to-data scale.

Definition at line 25330 of file qcustomplot.cpp.
| void QCPColorMap::setTightBoundary | ( | bool | enabled | ) |
Sets whether the outer most data rows and columns are clipped to the specified key and value range (see QCPColorMapData::setKeyRange, QCPColorMapData::setValueRange).
if enabled is set to false, the data points at the border of the color map are drawn with the same width and height as all other data points. Since the data points are represented by rectangles of one color centered on the data coordinate, this means that the shown color map extends by half a data point over the specified key/value range in each direction.

Definition at line 25347 of file qcustomplot.cpp.
|
inline |
Definition at line 5723 of file qcustomplot.h.
| void QCPColorMap::updateLegendIcon | ( | Qt::TransformationMode | transformMode = Qt::SmoothTransformation, |
| const QSize & | thumbSize = QSize(32, 18) |
||
| ) |
Takes the current appearance of the color map and updates the legend icon, which is used to represent this color map in the legend (see QCPLegend).
The transformMode specifies whether the rescaling is done by a faster, low quality image scaling algorithm (Qt::FastTransformation) or by a slower, higher quality algorithm (Qt::SmoothTransformation).
The current color map appearance is scaled down to thumbSize. Ideally, this should be equal to the size of the legend icon (see QCPLegend::setIconSize). If it isn't exactly the configured legend icon size, the thumb will be rescaled during drawing of the legend item.
Definition at line 25433 of file qcustomplot.cpp.
|
protectedvirtual |
Definition at line 25536 of file qcustomplot.cpp.
|
friend |
Definition at line 5773 of file qcustomplot.h.
|
friend |
Definition at line 5772 of file qcustomplot.h.
|
protected |
Definition at line 5758 of file qcustomplot.h.
|
protected |
Definition at line 5752 of file qcustomplot.h.
|
protected |
Definition at line 5753 of file qcustomplot.h.
|
protected |
Definition at line 5755 of file qcustomplot.h.
|
protected |
Definition at line 5756 of file qcustomplot.h.
|
protected |
Definition at line 5762 of file qcustomplot.h.
|
protected |
Definition at line 5754 of file qcustomplot.h.
|
protected |
Definition at line 5761 of file qcustomplot.h.
|
protected |
Definition at line 5763 of file qcustomplot.h.
|
protected |
Definition at line 5757 of file qcustomplot.h.
|
protected |
Definition at line 5761 of file qcustomplot.h.
 1.8.11
