|
SimCenterCommon
Common functionality used within different SimCenter projects
|
|
SimCenterCommon
Common functionality used within different SimCenter projects
|
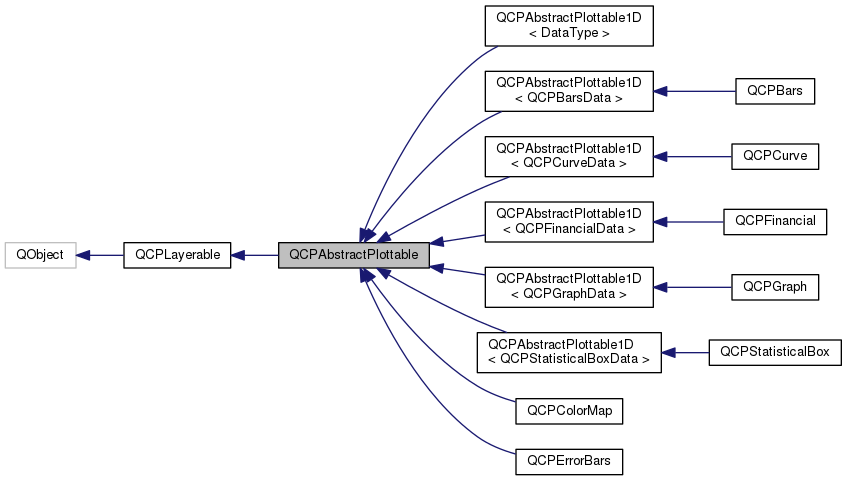
The abstract base class for all data representing objects in a plot. More...
#include <qcustomplot.h>
Signals | |
| void | selectionChanged (bool selected) |
| void | selectionChanged (const QCPDataSelection &selection) |
| void | selectableChanged (QCP::SelectionType selectable) |
 Signals inherited from QCPLayerable Signals inherited from QCPLayerable | |
| void | layerChanged (QCPLayer *newLayer) |
Public Member Functions | |
| QCPAbstractPlottable (QCPAxis *keyAxis, QCPAxis *valueAxis) | |
| virtual | ~QCPAbstractPlottable () |
| QString | name () const |
| bool | antialiasedFill () const |
| bool | antialiasedScatters () const |
| QPen | pen () const |
| QBrush | brush () const |
| QCPAxis * | keyAxis () const |
| QCPAxis * | valueAxis () const |
| QCP::SelectionType | selectable () const |
| bool | selected () const |
| QCPDataSelection | selection () const |
| QCPSelectionDecorator * | selectionDecorator () const |
| void | setName (const QString &name) |
| void | setAntialiasedFill (bool enabled) |
| void | setAntialiasedScatters (bool enabled) |
| void | setPen (const QPen &pen) |
| void | setBrush (const QBrush &brush) |
| void | setKeyAxis (QCPAxis *axis) |
| void | setValueAxis (QCPAxis *axis) |
| Q_SLOT void | setSelectable (QCP::SelectionType selectable) |
| Q_SLOT void | setSelection (QCPDataSelection selection) |
| void | setSelectionDecorator (QCPSelectionDecorator *decorator) |
| virtual double | selectTest (const QPointF &pos, bool onlySelectable, QVariant *details=0) const =0 |
| virtual QCPPlottableInterface1D * | interface1D () |
| virtual QCPRange | getKeyRange (bool &foundRange, QCP::SignDomain inSignDomain=QCP::sdBoth) const =0 |
| virtual QCPRange | getValueRange (bool &foundRange, QCP::SignDomain inSignDomain=QCP::sdBoth, const QCPRange &inKeyRange=QCPRange()) const =0 |
| void | coordsToPixels (double key, double value, double &x, double &y) const |
| const QPointF | coordsToPixels (double key, double value) const |
| void | pixelsToCoords (double x, double y, double &key, double &value) const |
| void | pixelsToCoords (const QPointF &pixelPos, double &key, double &value) const |
| void | rescaleAxes (bool onlyEnlarge=false) const |
| void | rescaleKeyAxis (bool onlyEnlarge=false) const |
| void | rescaleValueAxis (bool onlyEnlarge=false, bool inKeyRange=false) const |
| bool | addToLegend (QCPLegend *legend) |
| bool | addToLegend () |
| bool | removeFromLegend (QCPLegend *legend) const |
| bool | removeFromLegend () const |
| Public Member Functions inherited from QCPLayerable | |
| QCPLayerable (QCustomPlot *plot, QString targetLayer=QString(), QCPLayerable *parentLayerable=0) | |
| virtual | ~QCPLayerable () |
| bool | visible () const |
| QCustomPlot * | parentPlot () const |
| QCPLayerable * | parentLayerable () const |
| QCPLayer * | layer () const |
| bool | antialiased () const |
| void | setVisible (bool on) |
| Q_SLOT bool | setLayer (QCPLayer *layer) |
| bool | setLayer (const QString &layerName) |
| void | setAntialiased (bool enabled) |
| bool | realVisibility () const |
Protected Member Functions | |
| virtual QRect | clipRect () const Q_DECL_OVERRIDE |
| virtual void | draw (QCPPainter *painter) Q_DECL_OVERRIDE=0 |
| virtual QCP::Interaction | selectionCategory () const Q_DECL_OVERRIDE |
| void | applyDefaultAntialiasingHint (QCPPainter *painter) const Q_DECL_OVERRIDE |
| virtual void | selectEvent (QMouseEvent *event, bool additive, const QVariant &details, bool *selectionStateChanged) Q_DECL_OVERRIDE |
| virtual void | deselectEvent (bool *selectionStateChanged) Q_DECL_OVERRIDE |
| virtual void | drawLegendIcon (QCPPainter *painter, const QRectF &rect) const =0 |
| void | applyFillAntialiasingHint (QCPPainter *painter) const |
| void | applyScattersAntialiasingHint (QCPPainter *painter) const |
| Protected Member Functions inherited from QCPLayerable | |
| virtual void | parentPlotInitialized (QCustomPlot *parentPlot) |
| virtual void | mousePressEvent (QMouseEvent *event, const QVariant &details) |
| virtual void | mouseMoveEvent (QMouseEvent *event, const QPointF &startPos) |
| virtual void | mouseReleaseEvent (QMouseEvent *event, const QPointF &startPos) |
| virtual void | mouseDoubleClickEvent (QMouseEvent *event, const QVariant &details) |
| virtual void | wheelEvent (QWheelEvent *event) |
| void | initializeParentPlot (QCustomPlot *parentPlot) |
| void | setParentLayerable (QCPLayerable *parentLayerable) |
| bool | moveToLayer (QCPLayer *layer, bool prepend) |
| void | applyAntialiasingHint (QCPPainter *painter, bool localAntialiased, QCP::AntialiasedElement overrideElement) const |
Protected Attributes | |
| QString | mName |
| bool | mAntialiasedFill |
| bool | mAntialiasedScatters |
| QPen | mPen |
| QBrush | mBrush |
| QPointer< QCPAxis > | mKeyAxis |
| QPointer< QCPAxis > | mValueAxis |
| QCP::SelectionType | mSelectable |
| QCPDataSelection | mSelection |
| QCPSelectionDecorator * | mSelectionDecorator |
| Protected Attributes inherited from QCPLayerable | |
| bool | mVisible |
| QCustomPlot * | mParentPlot |
| QPointer< QCPLayerable > | mParentLayerable |
| QCPLayer * | mLayer |
| bool | mAntialiased |
Friends | |
| class | QCustomPlot |
| class | QCPAxis |
| class | QCPPlottableLegendItem |
The abstract base class for all data representing objects in a plot.
It defines a very basic interface like name, pen, brush, visibility etc. Since this class is abstract, it can't be instantiated. Use one of the subclasses or create a subclass yourself to create new ways of displaying data (see "Creating own plottables" below). Plottables that display one-dimensional data (i.e. data points have a single key dimension and one or multiple values at each key) are based off of the template subclass QCPAbstractPlottable1D, see details there.
All further specifics are in the subclasses, for example:
Subclassing directly from QCPAbstractPlottable is only recommended if you wish to display two-dimensional data like QCPColorMap, i.e. two logical key dimensions and one (or more) data dimensions. If you want to display data with only one logical key dimension, you should rather derive from QCPAbstractPlottable1D.
If subclassing QCPAbstractPlottable directly, these are the pure virtual functions you must implement:
See the documentation of those functions for what they need to do.
For drawing your plot, you can use the coordsToPixels functions to translate a point in plot coordinates to pixel coordinates. This function is quite convenient, because it takes the orientation of the key and value axes into account for you (x and y are swapped when the key axis is vertical and the value axis horizontal). If you are worried about performance (i.e. you need to translate many points in a loop like QCPGraph), you can directly use QCPAxis::coordToPixel. However, you must then take care about the orientation of the axis yourself.
Here are some important members you inherit from QCPAbstractPlottable:
| QCustomPlot *mParentPlot | A pointer to the parent QCustomPlot instance. The parent plot is inferred from the axes that are passed in the constructor. |
| QString mName | The name of the plottable. |
| QPen mPen | The generic pen of the plottable. You should use this pen for the most prominent data representing lines in the plottable (e.g QCPGraph uses this pen for its graph lines and scatters) |
| QBrush mBrush | The generic brush of the plottable. You should use this brush for the most prominent fillable structures in the plottable (e.g. QCPGraph uses this brush to control filling under the graph) |
| QPointer<QCPAxis> mKeyAxis, mValueAxis | The key and value axes this plottable is attached to. Call their QCPAxis::coordToPixel functions to translate coordinates to pixels in either the key or value dimension. Make sure to check whether the pointer is null before using it. If one of the axes is null, don't draw the plottable. |
| QCPSelectionDecorator mSelectionDecorator | The currently set selection decorator which specifies how selected data of the plottable shall be drawn and decorated. When drawing your data, you must consult this decorator for the appropriate pen/brush before drawing unselected/selected data segments. Finally, you should call its QCPSelectionDecorator::drawDecoration method at the end of your draw implementation. |
| QCP::SelectionType mSelectable | In which composition, if at all, this plottable's data may be selected. Enforcing this setting on the data selection is done by QCPAbstractPlottable automatically. |
| QCPDataSelection mSelection | Holds the current selection state of the plottable's data, i.e. the selected data ranges (QCPDataRange). |
Definition at line 3256 of file qcustomplot.h.
Constructs an abstract plottable which uses keyAxis as its key axis ("x") and valueAxis as its value axis ("y"). keyAxis and valueAxis must reside in the same QCustomPlot instance and have perpendicular orientations. If either of these restrictions is violated, a corresponding message is printed to the debug output (qDebug), the construction is not aborted, though.
Since QCPAbstractPlottable is an abstract class that defines the basic interface to plottables, it can't be directly instantiated.
You probably want one of the subclasses like QCPGraph or QCPCurve instead.
Definition at line 10434 of file qcustomplot.cpp.
|
virtual |
Definition at line 10455 of file qcustomplot.cpp.
| bool QCPAbstractPlottable::addToLegend | ( | QCPLegend * | legend | ) |
This is an overloaded member function, provided for convenience. It differs from the above function only in what argument(s) it accepts.
Adds this plottable to the specified legend.
Creates a QCPPlottableLegendItem which is inserted into the legend. Returns true on success, i.e. when the legend exists and a legend item associated with this plottable isn't already in the legend.
If the plottable needs a more specialized representation in the legend, you can create a corresponding subclass of QCPPlottableLegendItem and add it to the legend manually instead of calling this method.
Definition at line 10827 of file qcustomplot.cpp.
| bool QCPAbstractPlottable::addToLegend | ( | ) |
This is an overloaded member function, provided for convenience. It differs from the above function only in what argument(s) it accepts.
Adds this plottable to the legend of the parent QCustomPlot (QCustomPlot::legend).
Definition at line 10854 of file qcustomplot.cpp.
|
inline |
Definition at line 3277 of file qcustomplot.h.
|
inline |
Definition at line 3278 of file qcustomplot.h.
|
protectedvirtual |
Implements QCPLayerable.
Definition at line 10930 of file qcustomplot.cpp.
|
protected |
Definition at line 10946 of file qcustomplot.cpp.
|
protected |
Definition at line 10962 of file qcustomplot.cpp.
|
inline |
Definition at line 3280 of file qcustomplot.h.
|
protectedvirtual |
Reimplemented from QCPLayerable.
Definition at line 10901 of file qcustomplot.cpp.
| void QCPAbstractPlottable::coordsToPixels | ( | double | key, |
| double | value, | ||
| double & | x, | ||
| double & | y | ||
| ) | const |
Convenience function for transforming a key/value pair to pixels on the QCustomPlot surface, taking the orientations of the axes associated with this plottable into account (e.g. whether key represents x or y).
key and value are transformed to the coodinates in pixels and are written to x and y.
Definition at line 10646 of file qcustomplot.cpp.
| const QPointF QCPAbstractPlottable::coordsToPixels | ( | double | key, |
| double | value | ||
| ) | const |
This is an overloaded member function, provided for convenience. It differs from the above function only in what argument(s) it accepts.
Transforms the given key and value to pixel coordinates and returns them in a QPointF.
Definition at line 10667 of file qcustomplot.cpp.
|
protectedvirtual |
Reimplemented from QCPLayerable.
Definition at line 10999 of file qcustomplot.cpp.
|
protectedpure virtual |
Implements QCPLayerable.
Implemented in QCPErrorBars, QCPFinancial, QCPColorMap, QCPStatisticalBox, QCPBars, QCPCurve, and QCPGraph.
|
protectedpure virtual |
Implemented in QCPErrorBars, QCPFinancial, QCPColorMap, QCPStatisticalBox, QCPBars, QCPCurve, and QCPGraph.
|
pure virtual |
Returns the coordinate range that all data in this plottable span in the key axis dimension. For logarithmic plots, one can set inSignDomain to either QCP::sdNegative or QCP::sdPositive in order to restrict the returned range to that sign domain. E.g. when only negative range is wanted, set inSignDomain to QCP::sdNegative and all positive points will be ignored for range calculation. For no restriction, just set inSignDomain to QCP::sdBoth (default). foundRange is an output parameter that indicates whether a range could be found or not. If this is false, you shouldn't use the returned range (e.g. no points in data).
Note that foundRange is not the same as QCPRange::validRange, since the range returned by this function may have size zero (e.g. when there is only one data point). In this case foundRange would return true, but the returned range is not a valid range in terms of QCPRange::validRange.
Implemented in QCPErrorBars, QCPFinancial, QCPColorMap, QCPStatisticalBox, QCPBars, QCPCurve, and QCPGraph.
|
pure virtual |
Returns the coordinate range that the data points in the specified key range (inKeyRange) span in the value axis dimension. For logarithmic plots, one can set inSignDomain to either QCP::sdNegative or QCP::sdPositive in order to restrict the returned range to that sign domain. E.g. when only negative range is wanted, set inSignDomain to QCP::sdNegative and all positive points will be ignored for range calculation. For no restriction, just set inSignDomain to QCP::sdBoth (default). foundRange is an output parameter that indicates whether a range could be found or not. If this is false, you shouldn't use the returned range (e.g. no points in data).
If inKeyRange has both lower and upper bound set to zero (is equal to QCPRange()), all data points are considered, without any restriction on the keys.
Note that foundRange is not the same as QCPRange::validRange, since the range returned by this function may have size zero (e.g. when there is only one data point). In this case foundRange would return true, but the returned range is not a valid range in terms of QCPRange::validRange.
Implemented in QCPErrorBars, QCPFinancial, QCPColorMap, QCPStatisticalBox, QCPBars, QCPCurve, and QCPGraph.
|
inlinevirtual |
If this plottable is a one-dimensional plottable, i.e. it implements the QCPPlottableInterface1D, returns the this pointer with that type. Otherwise (e.g. in the case of a QCPColorMap) returns zero.
You can use this method to gain read access to data coordinates while holding a pointer to the abstract base class only.
Reimplemented in QCPErrorBars, QCPAbstractPlottable1D< DataType >, QCPAbstractPlottable1D< QCPFinancialData >, QCPAbstractPlottable1D< QCPStatisticalBoxData >, QCPAbstractPlottable1D< QCPGraphData >, QCPAbstractPlottable1D< QCPBarsData >, and QCPAbstractPlottable1D< QCPCurveData >.
Definition at line 3302 of file qcustomplot.h.
|
inline |
Definition at line 3281 of file qcustomplot.h.
|
inline |
Definition at line 3276 of file qcustomplot.h.
|
inline |
Definition at line 3279 of file qcustomplot.h.
| void QCPAbstractPlottable::pixelsToCoords | ( | double | x, |
| double | y, | ||
| double & | key, | ||
| double & | value | ||
| ) | const |
Convenience function for transforming a x/y pixel pair on the QCustomPlot surface to plot coordinates, taking the orientations of the axes associated with this plottable into account (e.g. whether key represents x or y).
x and y are transformed to the plot coodinates and are written to key and value.
Definition at line 10688 of file qcustomplot.cpp.
| void QCPAbstractPlottable::pixelsToCoords | ( | const QPointF & | pixelPos, |
| double & | key, | ||
| double & | value | ||
| ) | const |
This is an overloaded member function, provided for convenience. It differs from the above function only in what argument(s) it accepts.
Returns the pixel input pixelPos as plot coordinates key and value.
Definition at line 10709 of file qcustomplot.cpp.
| bool QCPAbstractPlottable::removeFromLegend | ( | QCPLegend * | legend | ) | const |
This is an overloaded member function, provided for convenience. It differs from the above function only in what argument(s) it accepts.
Removes the plottable from the specifed legend. This means the QCPPlottableLegendItem that is associated with this plottable is removed.
Returns true on success, i.e. if the legend exists and a legend item associated with this plottable was found and removed.
Definition at line 10872 of file qcustomplot.cpp.
| bool QCPAbstractPlottable::removeFromLegend | ( | ) | const |
This is an overloaded member function, provided for convenience. It differs from the above function only in what argument(s) it accepts.
Removes the plottable from the legend of the parent QCustomPlot.
Definition at line 10892 of file qcustomplot.cpp.
| void QCPAbstractPlottable::rescaleAxes | ( | bool | onlyEnlarge = false | ) | const |
Rescales the key and value axes associated with this plottable to contain all displayed data, so the whole plottable is visible. If the scaling of an axis is logarithmic, rescaleAxes will make sure not to rescale to an illegal range i.e. a range containing different signs and/or zero. Instead it will stay in the current sign domain and ignore all parts of the plottable that lie outside of that domain.
onlyEnlarge makes sure the ranges are only expanded, never reduced. So it's possible to show multiple plottables in their entirety by multiple calls to rescaleAxes where the first call has onlyEnlarge set to false (the default), and all subsequent set to true.
Definition at line 10727 of file qcustomplot.cpp.
| void QCPAbstractPlottable::rescaleKeyAxis | ( | bool | onlyEnlarge = false | ) | const |
Rescales the key axis of the plottable so the whole plottable is visible.
See rescaleAxes for detailed behaviour.
Definition at line 10738 of file qcustomplot.cpp.
| void QCPAbstractPlottable::rescaleValueAxis | ( | bool | onlyEnlarge = false, |
| bool | inKeyRange = false |
||
| ) | const |
Rescales the value axis of the plottable so the whole plottable is visible. If inKeyRange is set to true, only the data points which are in the currently visible key axis range are considered.
Returns true if the axis was actually scaled. This might not be the case if this plottable has an invalid range, e.g. because it has no data points.
See rescaleAxes for detailed behaviour.
Definition at line 10780 of file qcustomplot.cpp.
|
inline |
Definition at line 3283 of file qcustomplot.h.
|
signal |
This signal is emitted when the selectability of this plottable has changed.
|
inline |
Returns true if there are any data points of the plottable currently selected. Use selection to retrieve the current QCPDataSelection.
Definition at line 3284 of file qcustomplot.h.
|
protectedvirtual |
Reimplemented from QCPLayerable.
Definition at line 10968 of file qcustomplot.cpp.
|
inline |
Returns a QCPDataSelection encompassing all the data points that are currently selected on this plottable.
Definition at line 3285 of file qcustomplot.h.
|
protectedvirtual |
Reimplemented from QCPLayerable.
Definition at line 10910 of file qcustomplot.cpp.
|
signal |
This signal is emitted when the selection state of this plottable has changed, either by user interaction or by a direct call to setSelection. The parameter selected indicates whether there are any points selected or not.
|
signal |
This signal is emitted when the selection state of this plottable has changed, either by user interaction or by a direct call to setSelection. The parameter selection holds the currently selected data ranges.
|
inline |
Provides access to the selection decorator of this plottable. The selection decorator controls how selected data ranges are drawn (e.g. their pen color and fill), see QCPSelectionDecorator for details.
If you wish to use an own QCPSelectionDecorator subclass, pass an instance of it to setSelectionDecorator.
Definition at line 3286 of file qcustomplot.h.
|
pure virtual |
This function is used to decide whether a click hits a layerable object or not.
pos is a point in pixel coordinates on the QCustomPlot surface. This function returns the shortest pixel distance of this point to the object. If the object is either invisible or the distance couldn't be determined, -1.0 is returned. Further, if onlySelectable is true and the object is not selectable, -1.0 is returned, too.
If the object is represented not by single lines but by an area like a QCPItemText or the bars of a QCPBars plottable, a click inside the area should also be considered a hit. In these cases this function thus returns a constant value greater zero but still below the parent plot's selection tolerance. (typically the selectionTolerance multiplied by 0.99).
Providing a constant value for area objects allows selecting line objects even when they are obscured by such area objects, by clicking close to the lines (i.e. closer than 0.99*selectionTolerance).
The actual setting of the selection state is not done by this function. This is handled by the parent QCustomPlot when the mouseReleaseEvent occurs, and the finally selected object is notified via the selectEvent/deselectEvent methods.
details is an optional output parameter. Every layerable subclass may place any information in details. This information will be passed to selectEvent when the parent QCustomPlot decides on the basis of this selectTest call, that the object was successfully selected. The subsequent call to selectEvent will carry the details. This is useful for multi-part objects (like QCPAxis). This way, a possibly complex calculation to decide which part was clicked is only done once in selectTest. The result (i.e. the actually clicked part) can then be placed in details. So in the subsequent selectEvent, the decision which part was selected doesn't have to be done a second time for a single selection operation.
You may pass 0 as details to indicate that you are not interested in those selection details.
Reimplemented from QCPLayerable.
Implemented in QCPErrorBars, QCPFinancial, QCPColorMap, QCPStatisticalBox, QCPBars, QCPCurve, QCPGraph, QCPAbstractPlottable1D< DataType >, QCPAbstractPlottable1D< QCPFinancialData >, QCPAbstractPlottable1D< QCPStatisticalBoxData >, QCPAbstractPlottable1D< QCPGraphData >, QCPAbstractPlottable1D< QCPBarsData >, and QCPAbstractPlottable1D< QCPCurveData >.
| void QCPAbstractPlottable::setAntialiasedFill | ( | bool | enabled | ) |
Sets whether fills of this plottable are drawn antialiased or not.
Note that this setting may be overridden by QCustomPlot::setAntialiasedElements and QCustomPlot::setNotAntialiasedElements.
Definition at line 10479 of file qcustomplot.cpp.
| void QCPAbstractPlottable::setAntialiasedScatters | ( | bool | enabled | ) |
Sets whether the scatter symbols of this plottable are drawn antialiased or not.
Note that this setting may be overridden by QCustomPlot::setAntialiasedElements and QCustomPlot::setNotAntialiasedElements.
Definition at line 10490 of file qcustomplot.cpp.
| void QCPAbstractPlottable::setBrush | ( | const QBrush & | brush | ) |
The brush is used to draw basic fills of the plottable representation in the plot. The Fill can be a color, gradient or texture, see the usage of QBrush.
For example, the QCPGraph subclass draws the fill under the graph with this brush, when it's not set to Qt::NoBrush.
Definition at line 10517 of file qcustomplot.cpp.
| void QCPAbstractPlottable::setKeyAxis | ( | QCPAxis * | axis | ) |
The key axis of a plottable can be set to any axis of a QCustomPlot, as long as it is orthogonal to the plottable's value axis. This function performs no checks to make sure this is the case. The typical mathematical choice is to use the x-axis (QCustomPlot::xAxis) as key axis and the y-axis (QCustomPlot::yAxis) as value axis.
Normally, the key and value axes are set in the constructor of the plottable (or QCustomPlot::addGraph when working with QCPGraphs through the dedicated graph interface).
Definition at line 10533 of file qcustomplot.cpp.
| void QCPAbstractPlottable::setName | ( | const QString & | name | ) |
The name is the textual representation of this plottable as it is displayed in the legend (QCPLegend). It may contain any UTF-8 characters, including newlines.
Definition at line 10468 of file qcustomplot.cpp.
| void QCPAbstractPlottable::setPen | ( | const QPen & | pen | ) |
The pen is used to draw basic lines that make up the plottable representation in the plot.
For example, the QCPGraph subclass draws its graph lines with this pen.
Definition at line 10503 of file qcustomplot.cpp.
| void QCPAbstractPlottable::setSelectable | ( | QCP::SelectionType | selectable | ) |
Sets whether and to which granularity this plottable can be selected.
A selection can happen by clicking on the QCustomPlot surface (When QCustomPlot::setInteractions contains QCP::iSelectPlottables), by dragging a selection rect (When QCustomPlot::setSelectionRectMode is QCP::srmSelect), or programmatically by calling setSelection.
Definition at line 10620 of file qcustomplot.cpp.
| void QCPAbstractPlottable::setSelection | ( | QCPDataSelection | selection | ) |
Sets which data ranges of this plottable are selected. Selected data ranges are drawn differently (e.g. color) in the plot. This can be controlled via the selection decorator (see selectionDecorator).
The entire selection mechanism for plottables is handled automatically when QCustomPlot::setInteractions contains iSelectPlottables. You only need to call this function when you wish to change the selection state programmatically.
Using setSelectable you can further specify for each plottable whether and to which granularity it is selectable. If selection is not compatible with the current QCP::SelectionType set via setSelectable, the resulting selection will be adjusted accordingly (see QCPDataSelection::enforceType).
emits the selectionChanged signal when selected is different from the previous selection state.
Definition at line 10573 of file qcustomplot.cpp.
| void QCPAbstractPlottable::setSelectionDecorator | ( | QCPSelectionDecorator * | decorator | ) |
Use this method to set an own QCPSelectionDecorator (subclass) instance. This allows you to customize the visual representation of selected data ranges further than by using the default QCPSelectionDecorator.
The plottable takes ownership of the decorator.
The currently set decorator can be accessed via selectionDecorator.
Definition at line 10593 of file qcustomplot.cpp.
| void QCPAbstractPlottable::setValueAxis | ( | QCPAxis * | axis | ) |
The value axis of a plottable can be set to any axis of a QCustomPlot, as long as it is orthogonal to the plottable's key axis. This function performs no checks to make sure this is the case. The typical mathematical choice is to use the x-axis (QCustomPlot::xAxis) as key axis and the y-axis (QCustomPlot::yAxis) as value axis.
Normally, the key and value axes are set in the constructor of the plottable (or QCustomPlot::addGraph when working with QCPGraphs through the dedicated graph interface).
Definition at line 10549 of file qcustomplot.cpp.
|
inline |
Definition at line 3282 of file qcustomplot.h.
|
friend |
Definition at line 3355 of file qcustomplot.h.
|
friend |
Definition at line 3356 of file qcustomplot.h.
|
friend |
Definition at line 3354 of file qcustomplot.h.
|
protected |
Definition at line 3327 of file qcustomplot.h.
|
protected |
Definition at line 3327 of file qcustomplot.h.
|
protected |
Definition at line 3329 of file qcustomplot.h.
|
protected |
Definition at line 3330 of file qcustomplot.h.
|
protected |
Definition at line 3326 of file qcustomplot.h.
|
protected |
Definition at line 3328 of file qcustomplot.h.
|
protected |
Definition at line 3331 of file qcustomplot.h.
|
protected |
Definition at line 3332 of file qcustomplot.h.
|
protected |
Definition at line 3333 of file qcustomplot.h.
|
protected |
Definition at line 3330 of file qcustomplot.h.
 1.8.11
