|
SimCenterCommon
Common functionality used within different SimCenter projects
|
|
SimCenterCommon
Common functionality used within different SimCenter projects
|
A plottable representing a graph in a plot. More...
#include <qcustomplot.h>
Public Types | |
| enum | LineStyle { lsNone, lsLine, lsStepLeft, lsStepRight, lsStepCenter, lsImpulse } |
Public Member Functions | |
| QCPGraph (QCPAxis *keyAxis, QCPAxis *valueAxis) | |
| virtual | ~QCPGraph () |
| QSharedPointer< QCPGraphDataContainer > | data () const |
| LineStyle | lineStyle () const |
| QCPScatterStyle | scatterStyle () const |
| int | scatterSkip () const |
| QCPGraph * | channelFillGraph () const |
| bool | adaptiveSampling () const |
| void | setData (QSharedPointer< QCPGraphDataContainer > data) |
| void | setData (const QVector< double > &keys, const QVector< double > &values, bool alreadySorted=false) |
| void | setLineStyle (LineStyle ls) |
| void | setScatterStyle (const QCPScatterStyle &style) |
| void | setScatterSkip (int skip) |
| void | setChannelFillGraph (QCPGraph *targetGraph) |
| void | setAdaptiveSampling (bool enabled) |
| void | addData (const QVector< double > &keys, const QVector< double > &values, bool alreadySorted=false) |
| void | addData (double key, double value) |
| virtual double | selectTest (const QPointF &pos, bool onlySelectable, QVariant *details=0) const Q_DECL_OVERRIDE |
| virtual QCPRange | getKeyRange (bool &foundRange, QCP::SignDomain inSignDomain=QCP::sdBoth) const Q_DECL_OVERRIDE |
| virtual QCPRange | getValueRange (bool &foundRange, QCP::SignDomain inSignDomain=QCP::sdBoth, const QCPRange &inKeyRange=QCPRange()) const Q_DECL_OVERRIDE |
 Public Member Functions inherited from QCPAbstractPlottable1D< QCPGraphData > Public Member Functions inherited from QCPAbstractPlottable1D< QCPGraphData > | |
| QCPAbstractPlottable1D (QCPAxis *keyAxis, QCPAxis *valueAxis) | |
| virtual | ~QCPAbstractPlottable1D () |
| virtual int | dataCount () const |
| virtual double | dataMainKey (int index) const |
| virtual double | dataSortKey (int index) const |
| virtual double | dataMainValue (int index) const |
| virtual QCPRange | dataValueRange (int index) const |
| virtual QPointF | dataPixelPosition (int index) const |
| virtual bool | sortKeyIsMainKey () const |
| virtual QCPDataSelection | selectTestRect (const QRectF &rect, bool onlySelectable) const |
| virtual int | findBegin (double sortKey, bool expandedRange=true) const |
| virtual int | findEnd (double sortKey, bool expandedRange=true) const |
| virtual QCPPlottableInterface1D * | interface1D () |
| Public Member Functions inherited from QCPAbstractPlottable | |
| QCPAbstractPlottable (QCPAxis *keyAxis, QCPAxis *valueAxis) | |
| virtual | ~QCPAbstractPlottable () |
| QString | name () const |
| bool | antialiasedFill () const |
| bool | antialiasedScatters () const |
| QPen | pen () const |
| QBrush | brush () const |
| QCPAxis * | keyAxis () const |
| QCPAxis * | valueAxis () const |
| QCP::SelectionType | selectable () const |
| bool | selected () const |
| QCPDataSelection | selection () const |
| QCPSelectionDecorator * | selectionDecorator () const |
| void | setName (const QString &name) |
| void | setAntialiasedFill (bool enabled) |
| void | setAntialiasedScatters (bool enabled) |
| void | setPen (const QPen &pen) |
| void | setBrush (const QBrush &brush) |
| void | setKeyAxis (QCPAxis *axis) |
| void | setValueAxis (QCPAxis *axis) |
| Q_SLOT void | setSelectable (QCP::SelectionType selectable) |
| Q_SLOT void | setSelection (QCPDataSelection selection) |
| void | setSelectionDecorator (QCPSelectionDecorator *decorator) |
| void | coordsToPixels (double key, double value, double &x, double &y) const |
| const QPointF | coordsToPixels (double key, double value) const |
| void | pixelsToCoords (double x, double y, double &key, double &value) const |
| void | pixelsToCoords (const QPointF &pixelPos, double &key, double &value) const |
| void | rescaleAxes (bool onlyEnlarge=false) const |
| void | rescaleKeyAxis (bool onlyEnlarge=false) const |
| void | rescaleValueAxis (bool onlyEnlarge=false, bool inKeyRange=false) const |
| bool | addToLegend (QCPLegend *legend) |
| bool | addToLegend () |
| bool | removeFromLegend (QCPLegend *legend) const |
| bool | removeFromLegend () const |
| Public Member Functions inherited from QCPLayerable | |
| QCPLayerable (QCustomPlot *plot, QString targetLayer=QString(), QCPLayerable *parentLayerable=0) | |
| virtual | ~QCPLayerable () |
| bool | visible () const |
| QCustomPlot * | parentPlot () const |
| QCPLayerable * | parentLayerable () const |
| QCPLayer * | layer () const |
| bool | antialiased () const |
| void | setVisible (bool on) |
| Q_SLOT bool | setLayer (QCPLayer *layer) |
| bool | setLayer (const QString &layerName) |
| void | setAntialiased (bool enabled) |
| bool | realVisibility () const |
Protected Member Functions | |
| virtual void | draw (QCPPainter *painter) Q_DECL_OVERRIDE |
| virtual void | drawLegendIcon (QCPPainter *painter, const QRectF &rect) const Q_DECL_OVERRIDE |
| virtual void | drawFill (QCPPainter *painter, QVector< QPointF > *lines) const |
| virtual void | drawScatterPlot (QCPPainter *painter, const QVector< QPointF > &scatters, const QCPScatterStyle &style) const |
| virtual void | drawLinePlot (QCPPainter *painter, const QVector< QPointF > &lines) const |
| virtual void | drawImpulsePlot (QCPPainter *painter, const QVector< QPointF > &lines) const |
| virtual void | getOptimizedLineData (QVector< QCPGraphData > *lineData, const QCPGraphDataContainer::const_iterator &begin, const QCPGraphDataContainer::const_iterator &end) const |
| virtual void | getOptimizedScatterData (QVector< QCPGraphData > *scatterData, QCPGraphDataContainer::const_iterator begin, QCPGraphDataContainer::const_iterator end) const |
| void | getVisibleDataBounds (QCPGraphDataContainer::const_iterator &begin, QCPGraphDataContainer::const_iterator &end, const QCPDataRange &rangeRestriction) const |
| void | getLines (QVector< QPointF > *lines, const QCPDataRange &dataRange) const |
| void | getScatters (QVector< QPointF > *scatters, const QCPDataRange &dataRange) const |
| QVector< QPointF > | dataToLines (const QVector< QCPGraphData > &data) const |
| QVector< QPointF > | dataToStepLeftLines (const QVector< QCPGraphData > &data) const |
| QVector< QPointF > | dataToStepRightLines (const QVector< QCPGraphData > &data) const |
| QVector< QPointF > | dataToStepCenterLines (const QVector< QCPGraphData > &data) const |
| QVector< QPointF > | dataToImpulseLines (const QVector< QCPGraphData > &data) const |
| void | addFillBasePoints (QVector< QPointF > *lines) const |
| void | removeFillBasePoints (QVector< QPointF > *lines) const |
| QPointF | lowerFillBasePoint (double lowerKey) const |
| QPointF | upperFillBasePoint (double upperKey) const |
| const QPolygonF | getChannelFillPolygon (const QVector< QPointF > *lines) const |
| int | findIndexBelowX (const QVector< QPointF > *data, double x) const |
| int | findIndexAboveX (const QVector< QPointF > *data, double x) const |
| int | findIndexBelowY (const QVector< QPointF > *data, double y) const |
| int | findIndexAboveY (const QVector< QPointF > *data, double y) const |
| double | pointDistance (const QPointF &pixelPoint, QCPGraphDataContainer::const_iterator &closestData) const |
| Protected Member Functions inherited from QCPAbstractPlottable1D< QCPGraphData > | |
| void | getDataSegments (QList< QCPDataRange > &selectedSegments, QList< QCPDataRange > &unselectedSegments) const |
| void | drawPolyline (QCPPainter *painter, const QVector< QPointF > &lineData) const |
| Protected Member Functions inherited from QCPAbstractPlottable | |
| virtual QRect | clipRect () const Q_DECL_OVERRIDE |
| virtual QCP::Interaction | selectionCategory () const Q_DECL_OVERRIDE |
| void | applyDefaultAntialiasingHint (QCPPainter *painter) const Q_DECL_OVERRIDE |
| virtual void | selectEvent (QMouseEvent *event, bool additive, const QVariant &details, bool *selectionStateChanged) Q_DECL_OVERRIDE |
| virtual void | deselectEvent (bool *selectionStateChanged) Q_DECL_OVERRIDE |
| void | applyFillAntialiasingHint (QCPPainter *painter) const |
| void | applyScattersAntialiasingHint (QCPPainter *painter) const |
| Protected Member Functions inherited from QCPLayerable | |
| virtual void | parentPlotInitialized (QCustomPlot *parentPlot) |
| virtual void | mousePressEvent (QMouseEvent *event, const QVariant &details) |
| virtual void | mouseMoveEvent (QMouseEvent *event, const QPointF &startPos) |
| virtual void | mouseReleaseEvent (QMouseEvent *event, const QPointF &startPos) |
| virtual void | mouseDoubleClickEvent (QMouseEvent *event, const QVariant &details) |
| virtual void | wheelEvent (QWheelEvent *event) |
| void | initializeParentPlot (QCustomPlot *parentPlot) |
| void | setParentLayerable (QCPLayerable *parentLayerable) |
| bool | moveToLayer (QCPLayer *layer, bool prepend) |
| void | applyAntialiasingHint (QCPPainter *painter, bool localAntialiased, QCP::AntialiasedElement overrideElement) const |
Protected Attributes | |
| LineStyle | mLineStyle |
| QCPScatterStyle | mScatterStyle |
| int | mScatterSkip |
| QPointer< QCPGraph > | mChannelFillGraph |
| bool | mAdaptiveSampling |
| Protected Attributes inherited from QCPAbstractPlottable1D< QCPGraphData > | |
| QSharedPointer< QCPDataContainer< QCPGraphData > > | mDataContainer |
| Protected Attributes inherited from QCPAbstractPlottable | |
| QString | mName |
| bool | mAntialiasedFill |
| bool | mAntialiasedScatters |
| QPen | mPen |
| QBrush | mBrush |
| QPointer< QCPAxis > | mKeyAxis |
| QPointer< QCPAxis > | mValueAxis |
| QCP::SelectionType | mSelectable |
| QCPDataSelection | mSelection |
| QCPSelectionDecorator * | mSelectionDecorator |
| Protected Attributes inherited from QCPLayerable | |
| bool | mVisible |
| QCustomPlot * | mParentPlot |
| QPointer< QCPLayerable > | mParentLayerable |
| QCPLayer * | mLayer |
| bool | mAntialiased |
Friends | |
| class | QCustomPlot |
| class | QCPLegend |
Additional Inherited Members | |
| Signals inherited from QCPAbstractPlottable | |
| void | selectionChanged (bool selected) |
| void | selectionChanged (const QCPDataSelection &selection) |
| void | selectableChanged (QCP::SelectionType selectable) |
| Signals inherited from QCPLayerable | |
| void | layerChanged (QCPLayer *newLayer) |
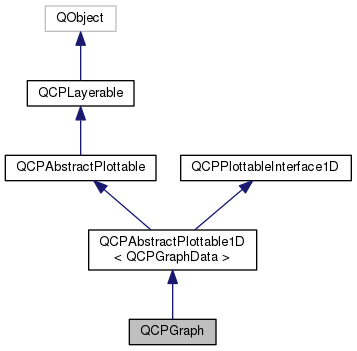
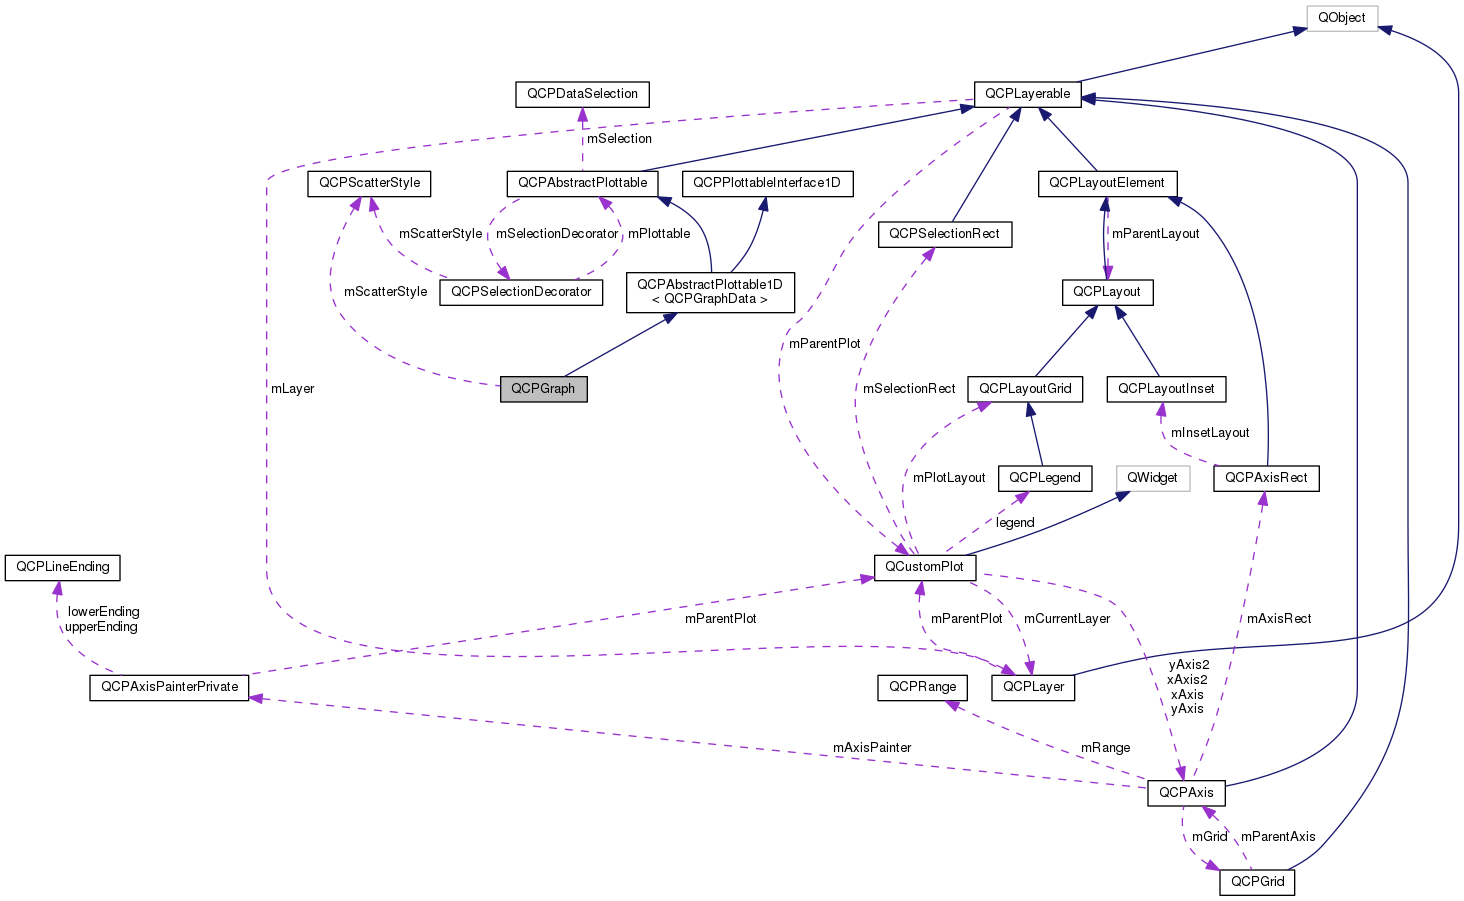
A plottable representing a graph in a plot.

Usually you create new graphs by calling QCustomPlot::addGraph. The resulting instance can be accessed via QCustomPlot::graph.
To plot data, assign it with the setData or addData functions. Alternatively, you can also access and modify the data via the data method, which returns a pointer to the internal QCPGraphDataContainer.
Graphs are used to display single-valued data. Single-valued means that there should only be one data point per unique key coordinate. In other words, the graph can't have loops. If you do want to plot non-single-valued curves, rather use the QCPCurve plottable.
Gaps in the graph line can be created by adding data points with NaN as value (qQNaN() or std::numeric_limits<double>::quiet_NaN()) in between the two data points that shall be separated.
The appearance of the graph is mainly determined by the line style, scatter style, brush and pen of the graph (setLineStyle, setScatterStyle, setBrush, setPen).
QCPGraph knows two types of fills: Normal graph fills towards the zero-value-line parallel to the key axis of the graph, and fills between two graphs, called channel fills. To enable a fill, just set a brush with setBrush which is neither Qt::NoBrush nor fully transparent.
By default, a normal fill towards the zero-value-line will be drawn. To set up a channel fill between this graph and another one, call setChannelFillGraph with the other graph as parameter.
Definition at line 5119 of file qcustomplot.h.
| enum QCPGraph::LineStyle |
Defines how the graph's line is represented visually in the plot. The line is drawn with the current pen of the graph (setPen).
| Enumerator | |
|---|---|
| lsNone |
data points are not connected with any lines (e.g. data only represented with symbols according to the scatter style, see setScatterStyle) |
| lsLine |
data points are connected by a straight line |
| lsStepLeft |
line is drawn as steps where the step height is the value of the left data point |
| lsStepRight |
line is drawn as steps where the step height is the value of the right data point |
| lsStepCenter |
line is drawn as steps where the step is in between two data points |
| lsImpulse |
each data point is represented by a line parallel to the value axis, which reaches from the data point to the zero-value-line |
Definition at line 5135 of file qcustomplot.h.
Constructs a graph which uses keyAxis as its key axis ("x") and valueAxis as its value axis ("y"). keyAxis and valueAxis must reside in the same QCustomPlot instance and not have the same orientation. If either of these restrictions is violated, a corresponding message is printed to the debug output (qDebug), the construction is not aborted, though.
The created QCPGraph is automatically registered with the QCustomPlot instance inferred from keyAxis. This QCustomPlot instance takes ownership of the QCPGraph, so do not delete it manually but use QCustomPlot::removePlottable() instead.
To directly create a graph inside a plot, you can also use the simpler QCustomPlot::addGraph function.
Definition at line 19783 of file qcustomplot.cpp.
|
virtual |
Definition at line 19798 of file qcustomplot.cpp.
|
inline |
Definition at line 5154 of file qcustomplot.h.
| void QCPGraph::addData | ( | const QVector< double > & | keys, |
| const QVector< double > & | values, | ||
| bool | alreadySorted = false |
||
| ) |
This is an overloaded member function, provided for convenience. It differs from the above function only in what argument(s) it accepts.
Adds the provided points in keys and values to the current data. The provided vectors should have equal length. Else, the number of added points will be the size of the smallest vector.
If you can guarantee that the passed data points are sorted by keys in ascending order, you can set alreadySorted to true, to improve performance by saving a sorting run.
Alternatively, you can also access and modify the data directly via the data method, which returns a pointer to the internal data container.
Definition at line 19954 of file qcustomplot.cpp.
| void QCPGraph::addData | ( | double | key, |
| double | value | ||
| ) |
This is an overloaded member function, provided for convenience. It differs from the above function only in what argument(s) it accepts.
Adds the provided data point as key and value to the current data.
Alternatively, you can also access and modify the data directly via the data method, which returns a pointer to the internal data container.
Definition at line 19980 of file qcustomplot.cpp.
|
protected |
Definition at line 20874 of file qcustomplot.cpp.
|
inline |
Definition at line 5153 of file qcustomplot.h.
|
inline |
Returns a shared pointer to the internal data storage of type QCPGraphDataContainer. You may use it to directly manipulate the data, which may be more convenient and faster than using the regular setData or addData methods.
Definition at line 5149 of file qcustomplot.h.
|
protected |
Definition at line 20429 of file qcustomplot.cpp.
|
protected |
Definition at line 20231 of file qcustomplot.cpp.
|
protected |
Definition at line 20368 of file qcustomplot.cpp.
|
protected |
Definition at line 20270 of file qcustomplot.cpp.
|
protected |
Definition at line 20319 of file qcustomplot.cpp.
|
protectedvirtual |
Implements QCPAbstractPlottable.
Definition at line 20020 of file qcustomplot.cpp.
|
protectedvirtual |
Definition at line 20479 of file qcustomplot.cpp.
|
protectedvirtual |
Definition at line 20536 of file qcustomplot.cpp.
|
protectedvirtual |
Implements QCPAbstractPlottable.
Definition at line 20088 of file qcustomplot.cpp.
|
protectedvirtual |
Definition at line 20519 of file qcustomplot.cpp.
|
protectedvirtual |
Definition at line 20505 of file qcustomplot.cpp.
|
protected |
Definition at line 21190 of file qcustomplot.cpp.
|
protected |
Definition at line 21234 of file qcustomplot.cpp.
|
protected |
Definition at line 21212 of file qcustomplot.cpp.
|
protected |
Definition at line 21316 of file qcustomplot.cpp.
|
protected |
Definition at line 21048 of file qcustomplot.cpp.
|
virtual |
Returns the coordinate range that all data in this plottable span in the key axis dimension. For logarithmic plots, one can set inSignDomain to either QCP::sdNegative or QCP::sdPositive in order to restrict the returned range to that sign domain. E.g. when only negative range is wanted, set inSignDomain to QCP::sdNegative and all positive points will be ignored for range calculation. For no restriction, just set inSignDomain to QCP::sdBoth (default). foundRange is an output parameter that indicates whether a range could be found or not. If this is false, you shouldn't use the returned range (e.g. no points in data).
Note that foundRange is not the same as QCPRange::validRange, since the range returned by this function may have size zero (e.g. when there is only one data point). In this case foundRange would return true, but the returned range is not a valid range in terms of QCPRange::validRange.
Implements QCPAbstractPlottable.
Definition at line 20008 of file qcustomplot.cpp.
|
protected |
Definition at line 20142 of file qcustomplot.cpp.
|
protectedvirtual |
Definition at line 20562 of file qcustomplot.cpp.
|
protectedvirtual |
Definition at line 20659 of file qcustomplot.cpp.
|
protected |
Definition at line 20180 of file qcustomplot.cpp.
|
virtual |
Returns the coordinate range that the data points in the specified key range (inKeyRange) span in the value axis dimension. For logarithmic plots, one can set inSignDomain to either QCP::sdNegative or QCP::sdPositive in order to restrict the returned range to that sign domain. E.g. when only negative range is wanted, set inSignDomain to QCP::sdNegative and all positive points will be ignored for range calculation. For no restriction, just set inSignDomain to QCP::sdBoth (default). foundRange is an output parameter that indicates whether a range could be found or not. If this is false, you shouldn't use the returned range (e.g. no points in data).
If inKeyRange has both lower and upper bound set to zero (is equal to QCPRange()), all data points are considered, without any restriction on the keys.
Note that foundRange is not the same as QCPRange::validRange, since the range returned by this function may have size zero (e.g. when there is only one data point). In this case foundRange would return true, but the returned range is not a valid range in terms of QCPRange::validRange.
Implements QCPAbstractPlottable.
Definition at line 20014 of file qcustomplot.cpp.
|
protected |
This method outputs the currently visible data range via begin and end. The returned range will also never exceed rangeRestriction.
This method takes into account that the drawing of data lines at the axis rect border always requires the points just outside the visible axis range. So begin and end may actually indicate a range that contains one additional data point to the left and right of the visible axis range.
Definition at line 20840 of file qcustomplot.cpp.
|
inline |
Definition at line 5150 of file qcustomplot.h.
|
protected |
Definition at line 20920 of file qcustomplot.cpp.
|
protected |
Definition at line 21260 of file qcustomplot.cpp.
|
protected |
Definition at line 20898 of file qcustomplot.cpp.
|
inline |
Definition at line 5152 of file qcustomplot.h.
|
inline |
Definition at line 5151 of file qcustomplot.h.
|
virtual |
Implements a point-selection algorithm assuming the data (accessed via the 1D data interface) is point-like. Most subclasses will want to reimplement this method again, to provide a more accurate hit test based on the true data visualization geometry.
Reimplemented from QCPAbstractPlottable1D< QCPGraphData >.
Definition at line 19986 of file qcustomplot.cpp.
| void QCPGraph::setAdaptiveSampling | ( | bool | enabled | ) |
Sets whether adaptive sampling shall be used when plotting this graph. QCustomPlot's adaptive sampling technique can drastically improve the replot performance for graphs with a larger number of points (e.g. above 10,000), without notably changing the appearance of the graph.
By default, adaptive sampling is enabled. Even if enabled, QCustomPlot decides whether adaptive sampling shall actually be used on a per-graph basis. So leaving adaptive sampling enabled has no disadvantage in almost all cases.

As can be seen, line plots experience no visual degradation from adaptive sampling. Outliers are reproduced reliably, as well as the overall shape of the data set. The replot time reduces dramatically though. This allows QCustomPlot to display large amounts of data in realtime.

Care must be taken when using high-density scatter plots in combination with adaptive sampling. The adaptive sampling algorithm treats scatter plots more carefully than line plots which still gives a significant reduction of replot times, but not quite as much as for line plots. This is because scatter plots inherently need more data points to be preserved in order to still resemble the original, non-adaptive-sampling plot. As shown above, the results still aren't quite identical, as banding occurs for the outer data points. This is in fact intentional, such that the boundaries of the data cloud stay visible to the viewer. How strong the banding appears, depends on the point density, i.e. the number of points in the plot.
For some situations with scatter plots it might thus be desirable to manually turn adaptive sampling off. For example, when saving the plot to disk. This can be achieved by setting enabled to false before issuing a command like QCustomPlot::savePng, and setting enabled back to true afterwards.
Definition at line 19937 of file qcustomplot.cpp.
| void QCPGraph::setChannelFillGraph | ( | QCPGraph * | targetGraph | ) |
Sets the target graph for filling the area between this graph and targetGraph with the current brush (setBrush).
When targetGraph is set to 0, a normal graph fill to the zero-value-line will be shown. To disable any filling, set the brush to Qt::NoBrush.
Definition at line 19886 of file qcustomplot.cpp.
| void QCPGraph::setData | ( | QSharedPointer< QCPGraphDataContainer > | data | ) |
This is an overloaded member function, provided for convenience. It differs from the above function only in what argument(s) it accepts.
Replaces the current data container with the provided data container.
Since a QSharedPointer is used, multiple QCPGraphs may share the same data container safely. Modifying the data in the container will then affect all graphs that share the container. Sharing can be achieved by simply exchanging the data containers wrapped in shared pointers:
If you do not wish to share containers, but create a copy from an existing container, rather use the QCPDataContainer<DataType>::set method on the graph's data container directly:
Definition at line 19817 of file qcustomplot.cpp.
| void QCPGraph::setData | ( | const QVector< double > & | keys, |
| const QVector< double > & | values, | ||
| bool | alreadySorted = false |
||
| ) |
This is an overloaded member function, provided for convenience. It differs from the above function only in what argument(s) it accepts.
Replaces the current data with the provided points in keys and values. The provided vectors should have equal length. Else, the number of added points will be the size of the smallest vector.
If you can guarantee that the passed data points are sorted by keys in ascending order, you can set alreadySorted to true, to improve performance by saving a sorting run.
Definition at line 19833 of file qcustomplot.cpp.
| void QCPGraph::setLineStyle | ( | LineStyle | ls | ) |
Sets how the single data points are connected in the plot. For scatter-only plots, set ls to lsNone and setScatterStyle to the desired scatter style.
Definition at line 19845 of file qcustomplot.cpp.
| void QCPGraph::setScatterSkip | ( | int | skip | ) |
If scatters are displayed (scatter style not QCPScatterStyle::ssNone), skip number of scatter points are skipped/not drawn after every drawn scatter point.
This can be used to make the data appear sparser while for example still having a smooth line, and to improve performance for very high density plots.
If skip is set to 0 (default), all scatter points are drawn.
Definition at line 19872 of file qcustomplot.cpp.
| void QCPGraph::setScatterStyle | ( | const QCPScatterStyle & | style | ) |
Sets the visual appearance of single data points in the plot. If set to QCPScatterStyle::ssNone, no scatter points are drawn (e.g. for line-only-plots with appropriate line style).
Definition at line 19856 of file qcustomplot.cpp.
|
protected |
Definition at line 20985 of file qcustomplot.cpp.
|
friend |
Definition at line 5216 of file qcustomplot.h.
|
friend |
Definition at line 5215 of file qcustomplot.h.
|
protected |
Definition at line 5180 of file qcustomplot.h.
|
protected |
Definition at line 5179 of file qcustomplot.h.
|
protected |
Definition at line 5176 of file qcustomplot.h.
|
protected |
Definition at line 5178 of file qcustomplot.h.
|
protected |
Definition at line 5177 of file qcustomplot.h.
 1.8.11
