2.8. RES: Results
A successful run or download of a job that ran successfully at DesignSafe will result in 2 tabbed widgets displayed in the results panel. The first tab, as shown in Fig. 2.8.1 shows the summary statistics: mean, stdDev, and kurtosis.
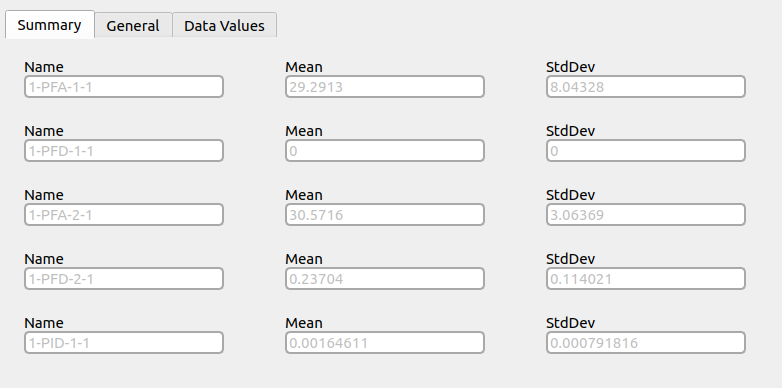
Fig. 2.8.1 Results summary.
The second panel, shown in Fig. 2.8.2 presents the results both graphically and in tabular form. By selecting different columns with left and right mouse buttons in the table below the graphic, the information in the graph is changed. Selecting the left mouse button changes the Y-axis, the right mouse changes the X-axis. If the same column is selected using both left and right keys, either the CDF and PDF are displayed. If the last mouse press was with the left button, the PDF would be displayed; if the previous mouse press was the right one, the CDF would be displayed.
Regarding the columns in the table below the figure: You will see a column for each random variable the workflow came across and then the columns for the response quantities. There may be more random variables than you specified. This is because, for specific applications, the user may introduce additional random variables for the UQ engine to consider.
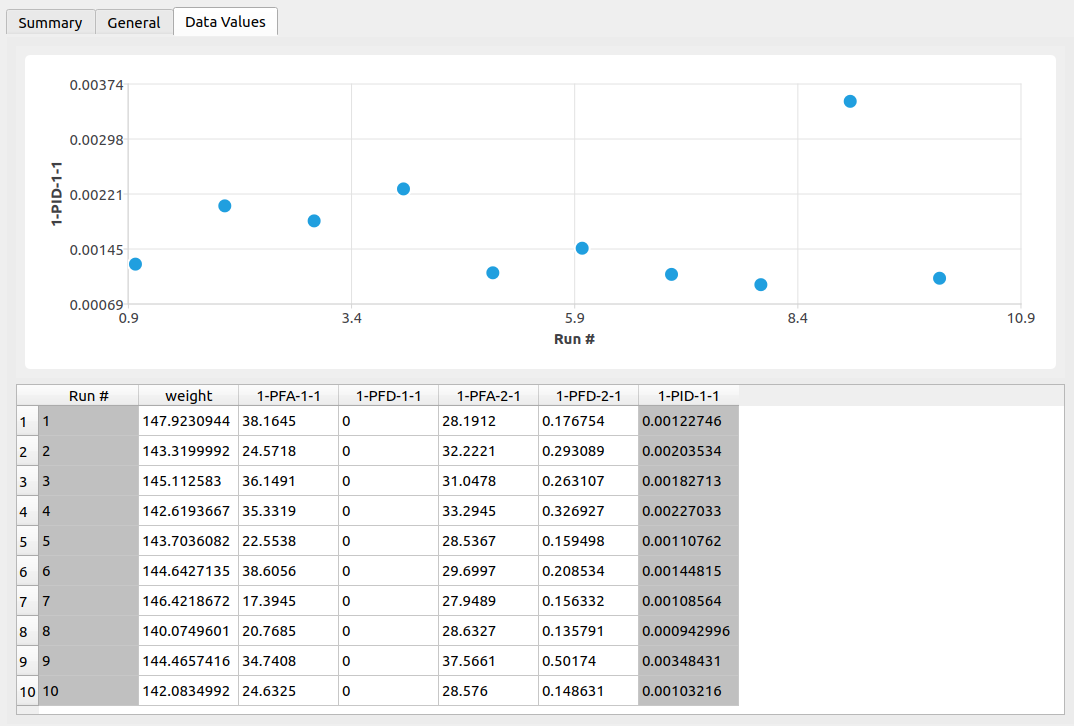
Fig. 2.8.2 Results are presented both graphically and in tabular form.
2.8.1. Event results
In case results from the CFD event are requested as shown in Fig. 2.8.1.1, these results will be available for download from the Data Depot in the DesignSafe portal.
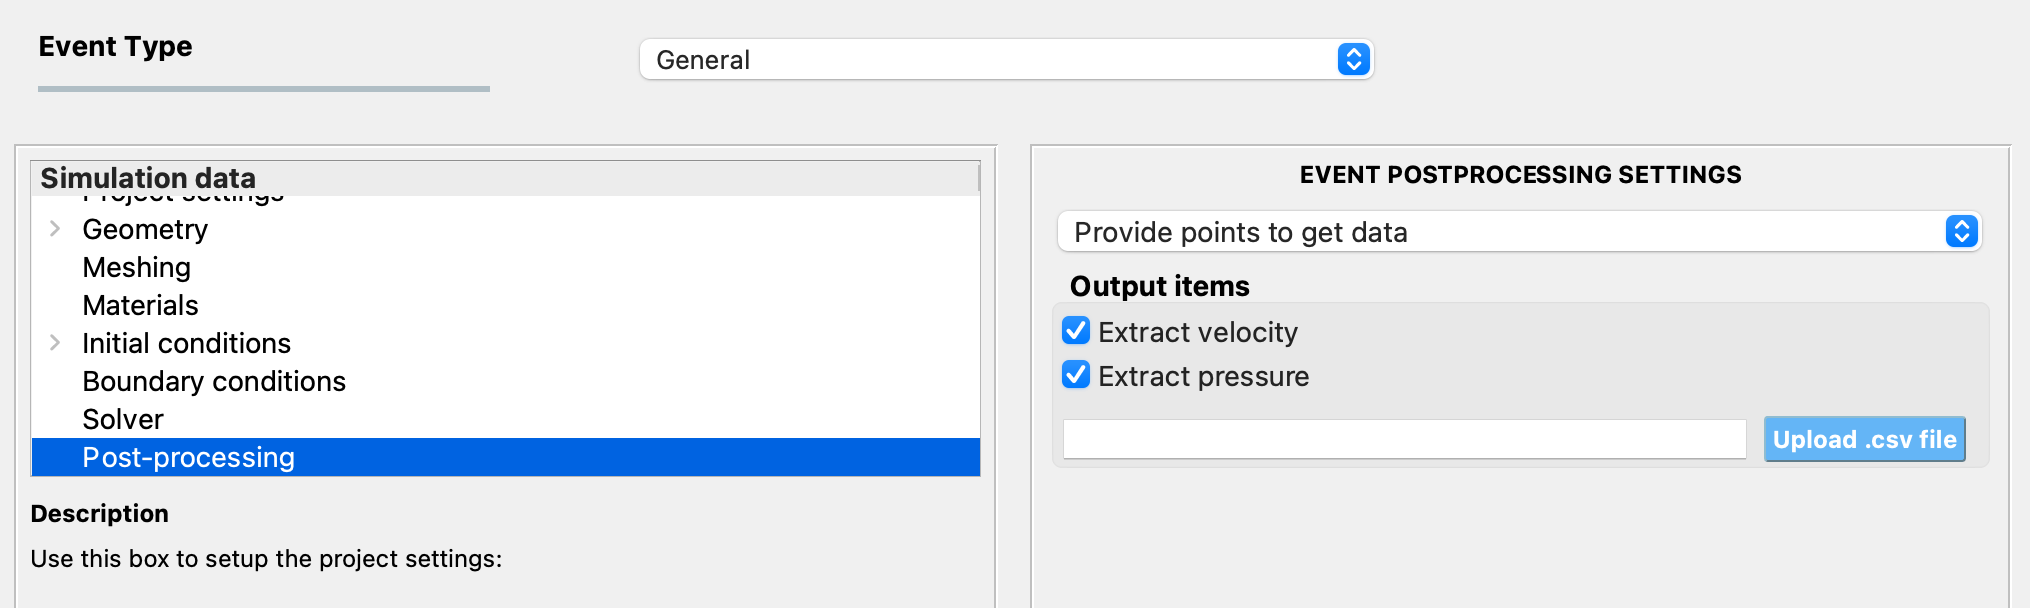
Fig. 2.8.1.1 Selection of event results.
Note
If you would like to visualize the event results in the RES widget, please let us know using the Bugs & Feature Requests.