Cylinder Half-Submerged in Flow - UW WASIRF Twin - FOAMySees (OpenFOAM + OpenSees)
Problem files |
Overview
This example demonstrates how to run a coupled OpenSees-OpenFOAM simulation (FOAMySees) to determine floor loads on a building caused by strongly coupled, two-way fluid-structure interaction. You can then perform an OpenSees simulation of the building assuming uncertainties in the building properties.
A truncated digital twin of the UW WASIRF wave flume contains a simple cantilevered cylinder. The cylinder, our structure, is half-submerged. The flow around the cylinder is calculated for a given period of time in order to determine a simulated structural response time-series under wave loading.
Outputs of the EVT simulation will include results, sampled at specified frequencies, for the:
Fluid flow’s free surface elevation at wave gauges
Flow velocity at velocimeter locations
Fluid pressure at piezometers locations
FSI forces and moments at the structural interface
Cross-section cuts of the OpenFOAM continuum
As the EVT and FEM functionality are effectively fused for FOAMySees, the FEM tab will be envisioned as providing additional results in the form of:
Time-series motion of any structural nodes with defined recorders in the OpenSees model.
The EDP tab will then process these results.
Displacement of the cylinder tip from rest, peak relative-floor displacement (PFD)
Displacement of the cylinder tip relative to its base or supporting, peak inter-story drift (PID)
Peak floor acceleration (PFA)
Set-Up
The case is set up in the HydroUQ tool on DesignSafe. You can select the case from the list of available examples off of the HydroUQ menubar, i.e. Examples / hdro-0003. The case is set up as follows.
The flume is 1 meter wide (from Y=-0.5m to Y=0.5 m), 1 meter tall (Z=0.0m to Z=1.0m), and 4 meters long (X=0.0m to X=4.0m). The cardinal direction Z+ is vertical, X+ is downstream, and Y+ is crossflow. Gravity is -9.81 m / s^2 in the Z direction.
The case is initialized with a still water level of 0.25 meters. The velocity at the inlet is given a time history boundary condition, src/VelTime.csv.
This structure is a simple cylinder. It has a diameter 0.1 meters and it is located at X=1.5, Y=0.0, Z=0.0. The length of the cylinder is 0.5 meters in Z+.
The cylinder is represented in OpenSees by a cantilevered beam, with an elastic section, modelled with displacement-action controlled beam elements. The bottom of the cantilevered beam is fixed at Z=0.0.
The constrained node is removed from the coupled solution, by omitting it from the list coupledNodes in the OpenSees model file.
The interface surface file is 'src/interface.stl'.
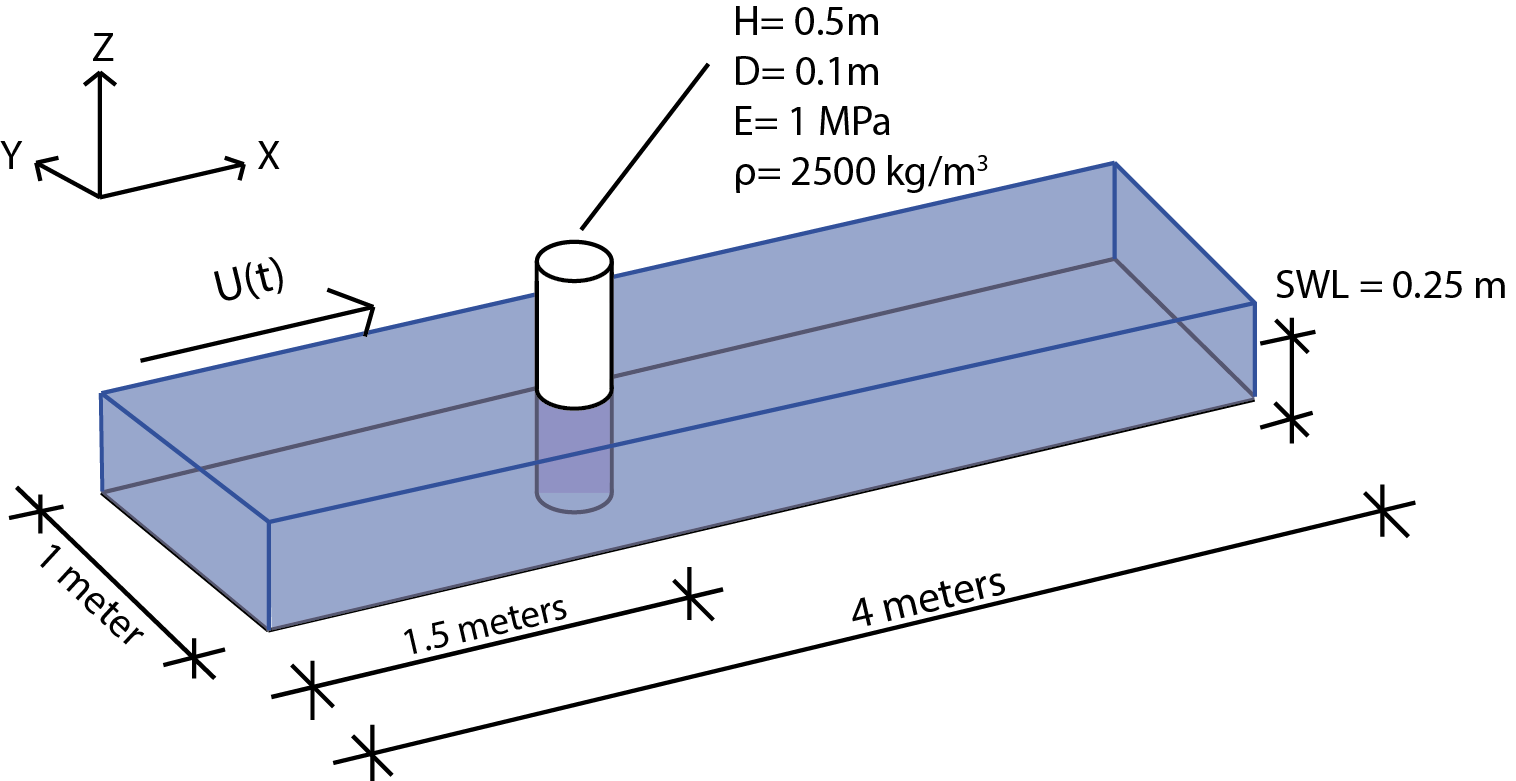
Schematic of the digital twin example in the UW WASIRF truncated flume
Probe positions in the digital flume are set at the following locations:
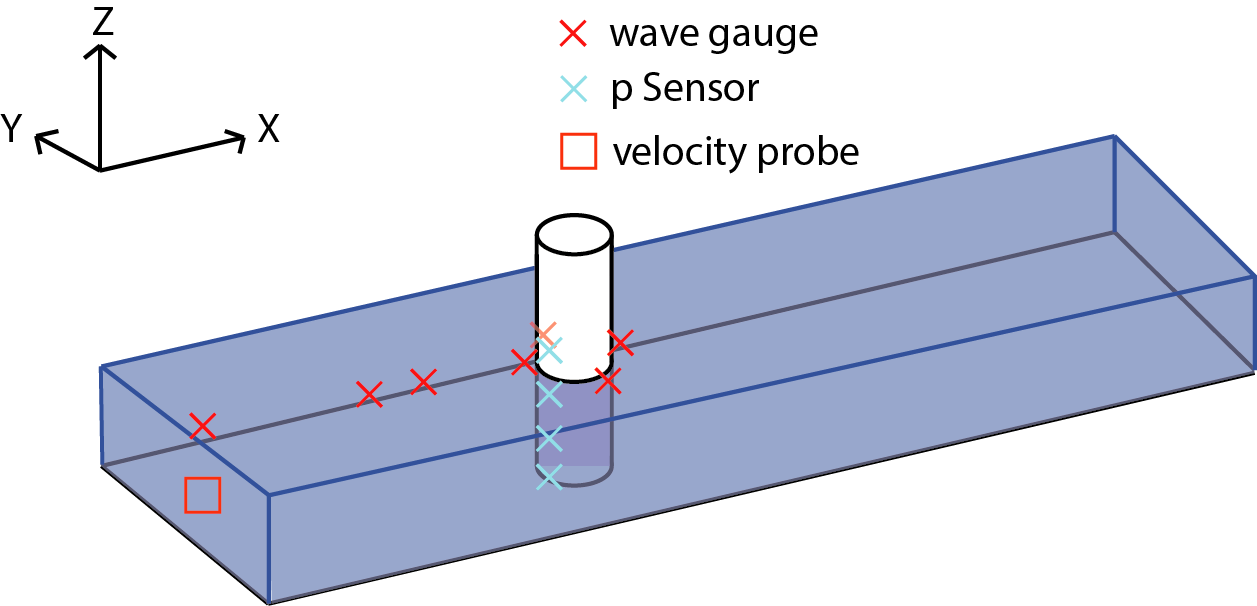
Instrumentation locations in theUW WASIRF truncated digital flume
Inlet Velocity Time History (U(t)) for the truncated digital twin is given by the following function in OpenFOAM:
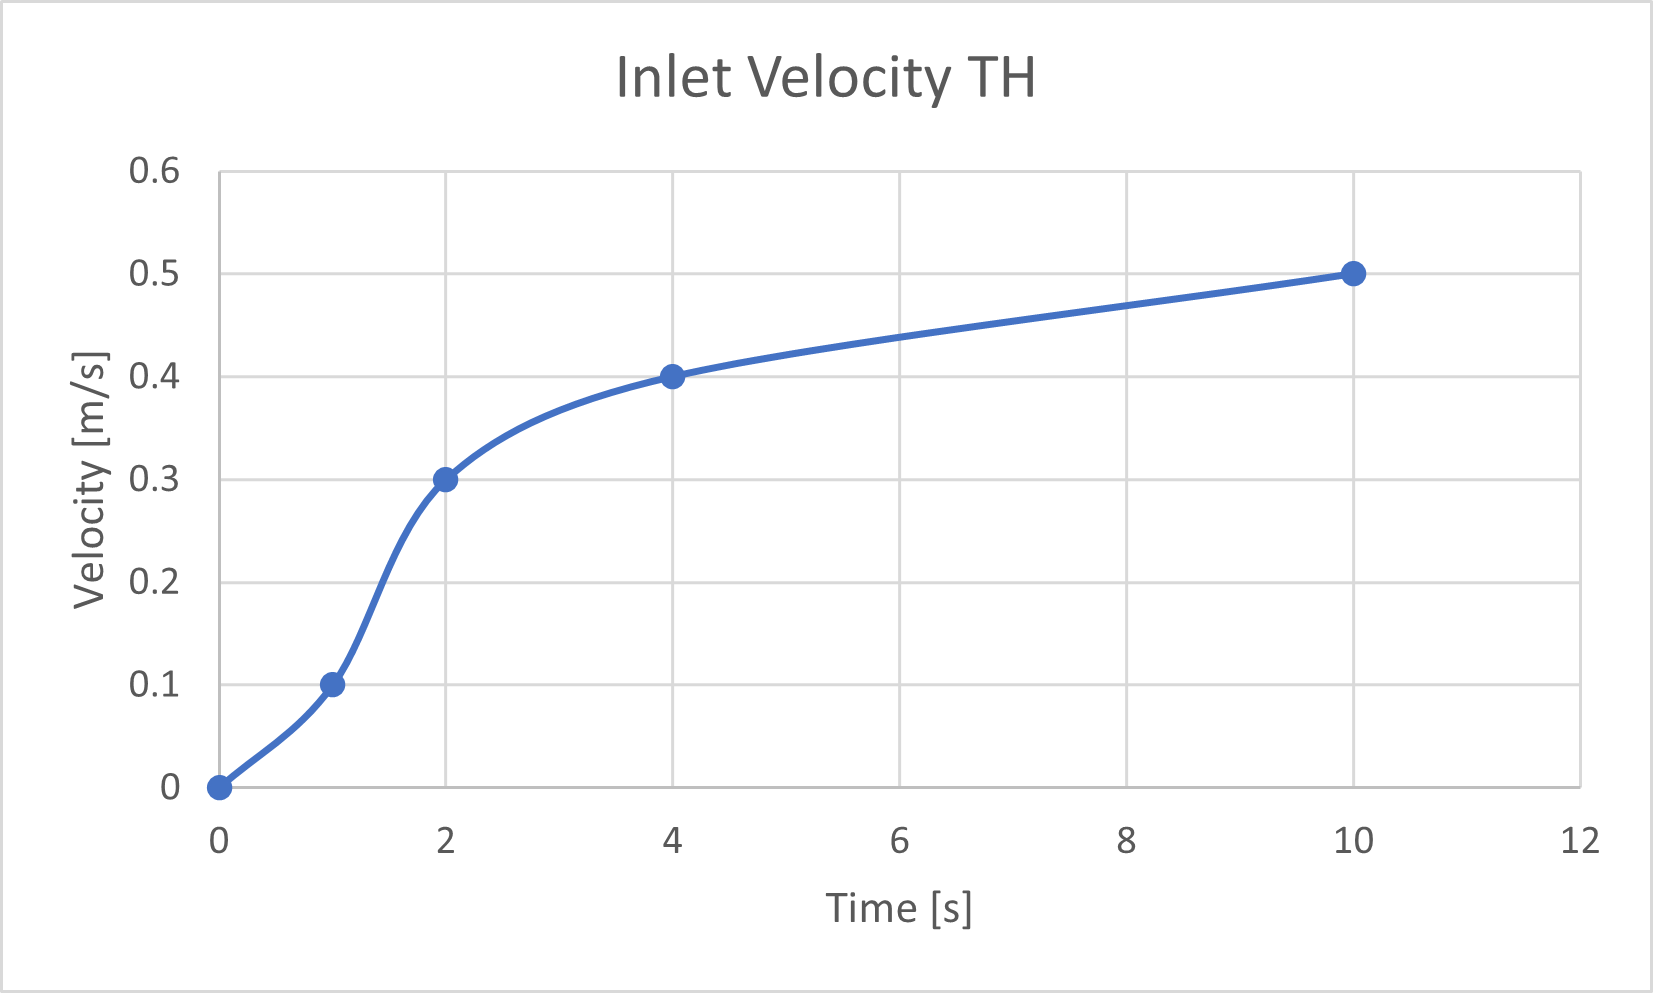
Inlet Velocity Time History for the UW WASIRF digital twin
We now have a coupled simulation configured for fluid flow around, and the structural response of, a cylinder. Next, we will run the simulation on a remote TACC high-performance computing system.
Simulation
Login to DesignSafe and submit the job to run remotely on a TACC system, either Frontera or Stampede3.
Simulation time for 1 second in the digital flume took 1 hour and 20 minutes. This was using one computational node on TACC Frontera, possessing 56 cores.
The case can be run for as long as desired, but mind that the longer the case runs, the longer the postprocessing routines will be.
In order to retrieve results from the analysis, the job must complete and post-process the model output files into a VTK format before the end of the allotted submission time.
Important
Provide a large amount of time for the Max Run Time field in HydroUQ when submitting a job to ensure the model completes before the time allotted runs out!
Note
Be aware that the smaller the OpenFOAM Outputs and OpenSees Outputs Time Interval value is, the longer the post-processing of the case will take after analysis has been completed,
and the larger the results.zip folder will be.
Warning
Be modest when requesting simulation outputs across many recording probes or full geometry snapshots. Only ask for what you need, or your simulation will become slow due to I/O constraints and the output data will be too large to effectively post-process or host on your local machine.
Results
First, we must retrieve the results.zip folder from the DesignSafe file storage. This zip file will contain all our from the Tools and Applications Page of Design Safe
Locating the job files on DesignSafe
Check if the job has finished. If it has, click ‘More info’.
Once the job is finished, the output files should be available in the directory to which the analysis results were sent to
Find the files by clicking ‘View’.
Directory shown on DesignSafe contains the results.zip output for a HydroUQ EVT simulation. Download the results.zip folder to your local machine to view the model results.
Move the results.zip to somewhere in My Data/. Use the Extractor tool available on DesignSafe. Unzip the results.zip folder.
OR Download the results.zip folder to your PC and unzip to look at the model results.
Download the results to look at the VTK files of the analysis. This will include OpenFOAM and OpenSees field data and model geometry
Extract the Zip folder either on DesignSafe or on your local machine. You will need Paraview to view the model data.

Locate the zip folder and extract it to somewhere convenient
The results folder should look something like this.

This is the output of the model
Analysis
Paraview files have a .PVD extension. Open VTK/Fluid.vtm.series to look at OpenFOAM results. Open OpenSeesOutput.pvd to look at OpenSees results.
This is the model output data as seen from ParaView
OpenSees Displacements And Reactions
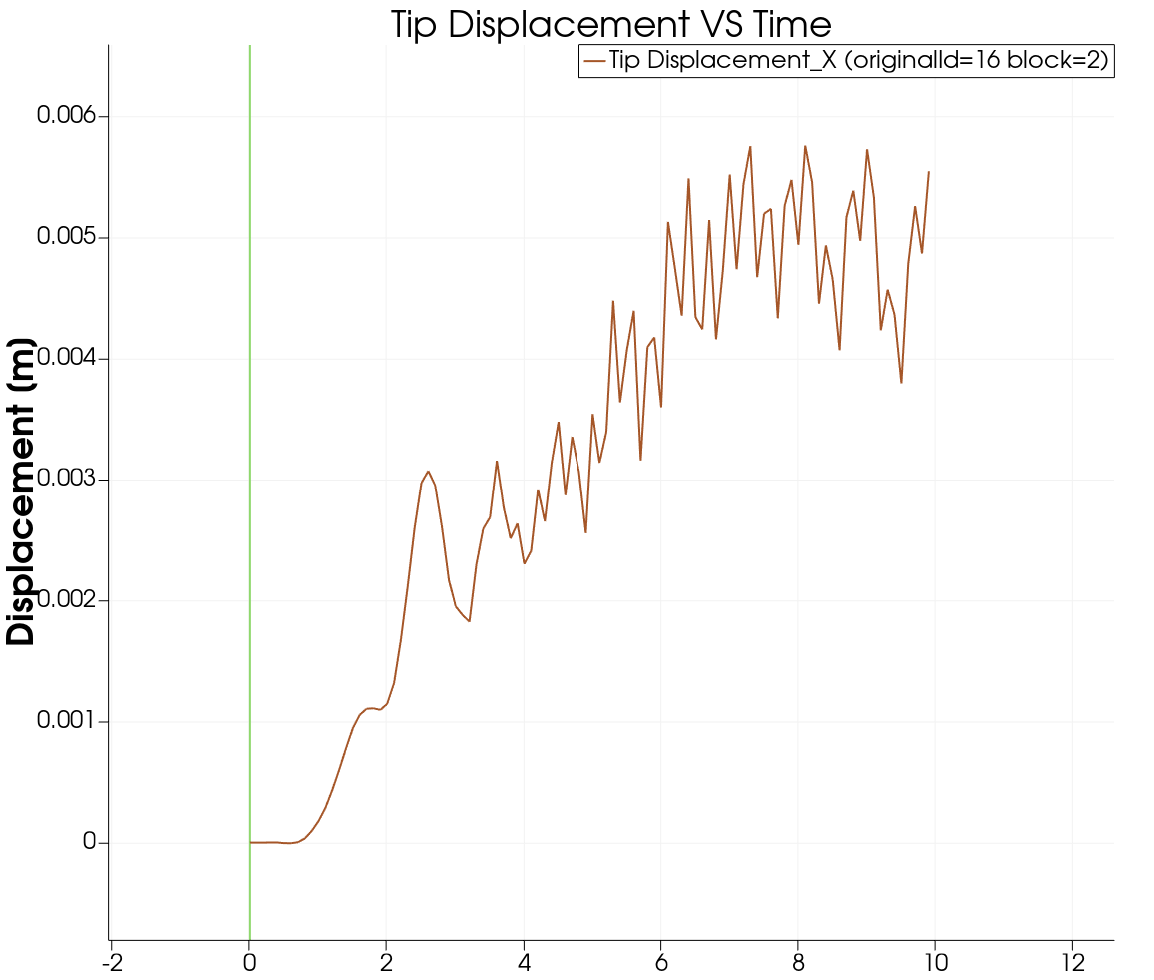
This is the model output data as seen from ParaView
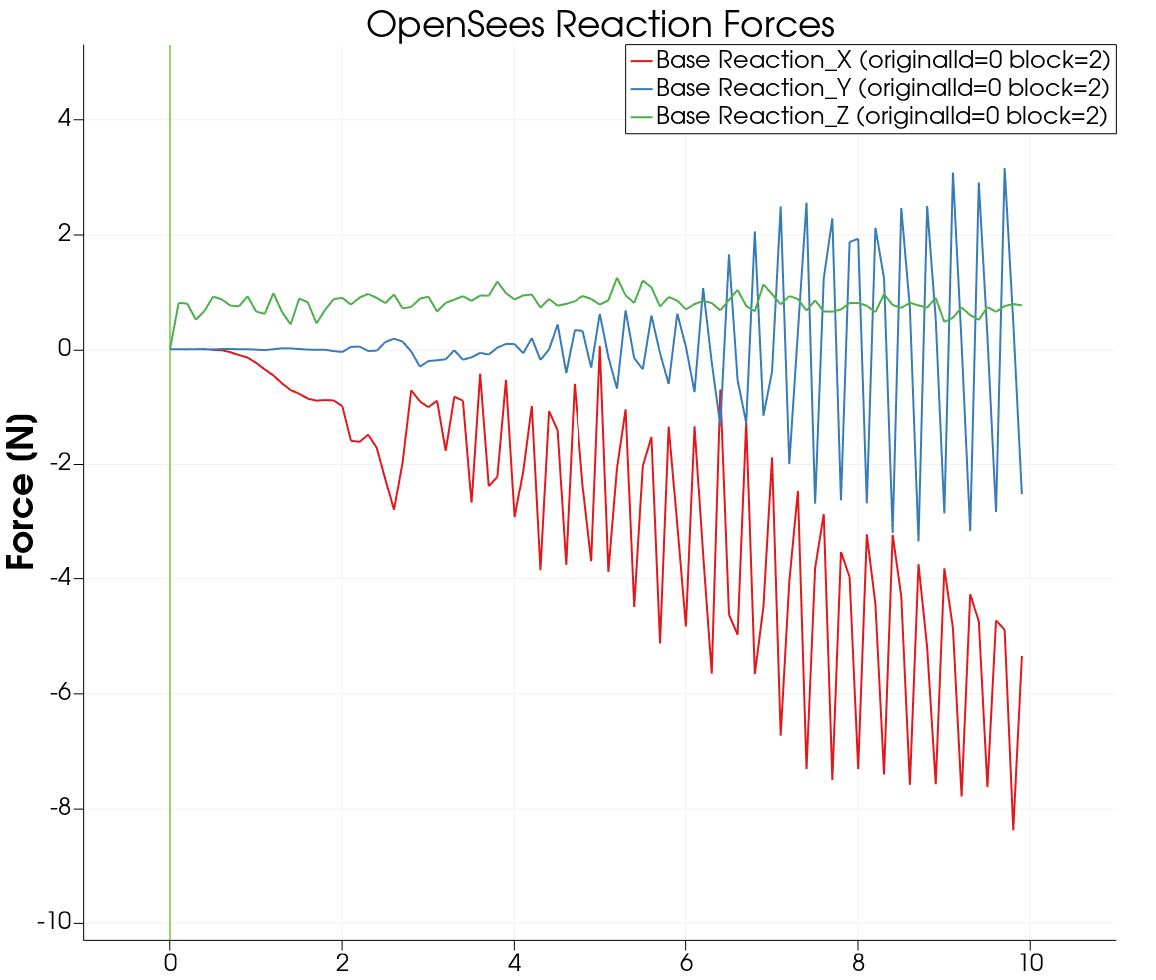
This is the model output data as seen from ParaView
OpenFOAM probe and function object output is available in results/postProcessing/. OpenFOAM output is currently unorganized. An example Matlab script is provided in the src/ directory to post process the OpenFOAM output for this particular case and output.
This file can be modified to work for any case. The names of the data folders will need to be changed according to the name of the probe given in HydroUQ.
OpenFOAM Calculated Story Forces are
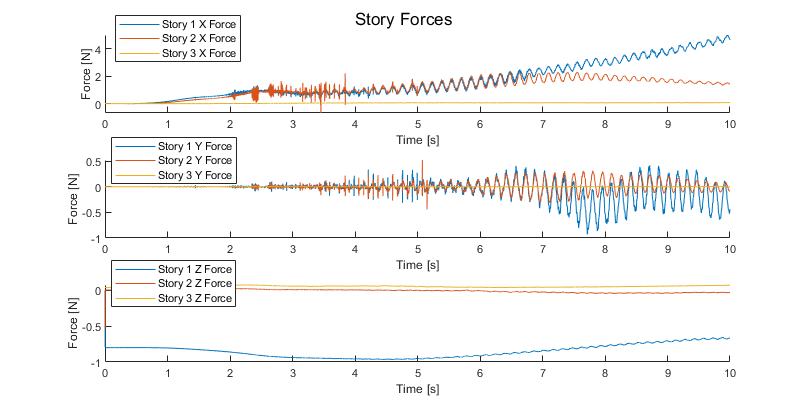
Story Forces in OpenFOAM
OpenFOAM Calculated Coupled Interface Forces are visualized in the following figure
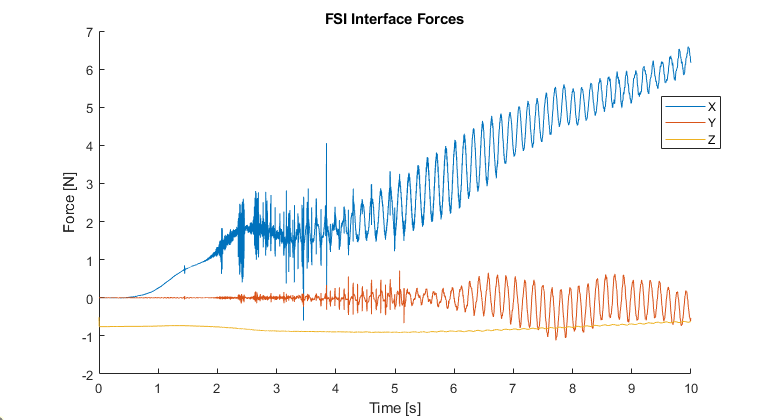
Coupled Interface Forces in OpenFOAM-OpenSees
OpenFOAM calculated, coupled interface moments at the structural surface are
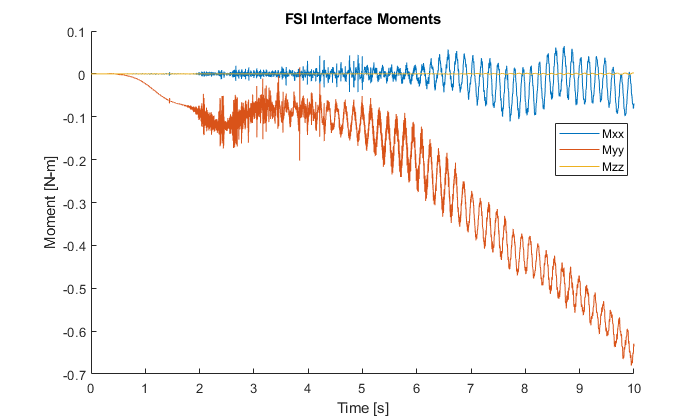
Coupled Interface Moments in OpenFOAM-OpenSees
OpenFOAM calculated pressure probe values throughout the flume are
OpenFOAM calculated fluid velocity probe values throughout the flume are
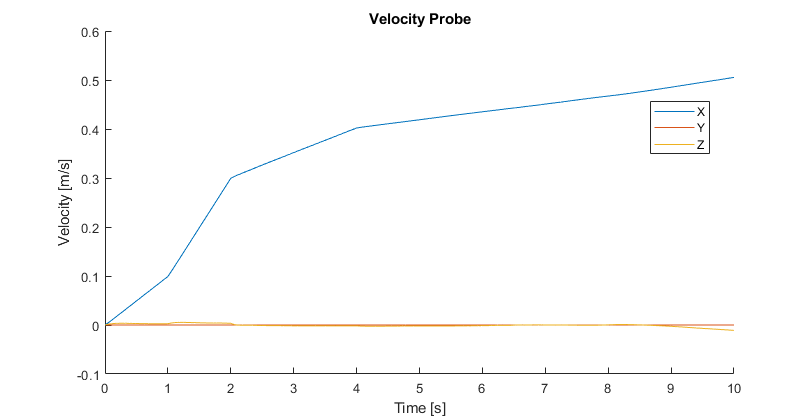
Velocity Probe Values in OpenFOAM
OpenFOAM calculated wave gauge free-surface values at key locations in the facility are
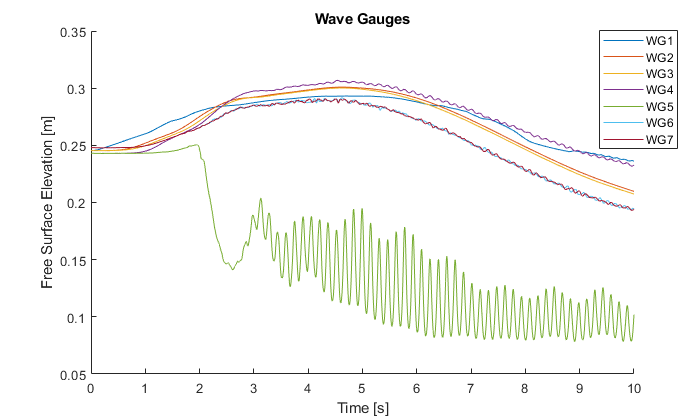
Wave Gauge Free-Surface Probe Values in OpenFOAM
This completes the analysis of the model. In validation of any flume experimental case, a similar process may be employed with an added step of comparison to experimental data.
References
Lewis, N. (2023). Development of An Open-Source Methodology for Simulation of Civil Engineering Structures Subject to Multi-Hazards. PhD thesis, University of Washington, Seattle, WA. ISBN: 979-8-381408-69-0.
OpenFOAM. OpenFOAM Foundation. https://www.openfoam.com/
OpenSees. Pacific Earthquake Engineering Research Center. http://opensees.berkeley.edu/
Paraview. Kitware. https://www.paraview.org/
DesignSafe**. DesignSafe-CI. https://www.designsafe-ci.org/
TACC. Texas Advanced Computing Center. https://www.tacc.utexas.edu/
Frontera. Texas Advanced Computing Center. https://frontera-portal.tacc.utexas.edu/
Stampede3. Texas Advanced Computing Center. https://stampede2.tacc.utexas.edu/