5.2. Forward Propagation - OpenSeesPy
Problem files |
This example illustrates how quoFEM interacts with OpenSeesPy. A simple forward propagation procedure is run to estimate the first and second central moments of a FE model’s response, given the marginal distributions of various random parameters.
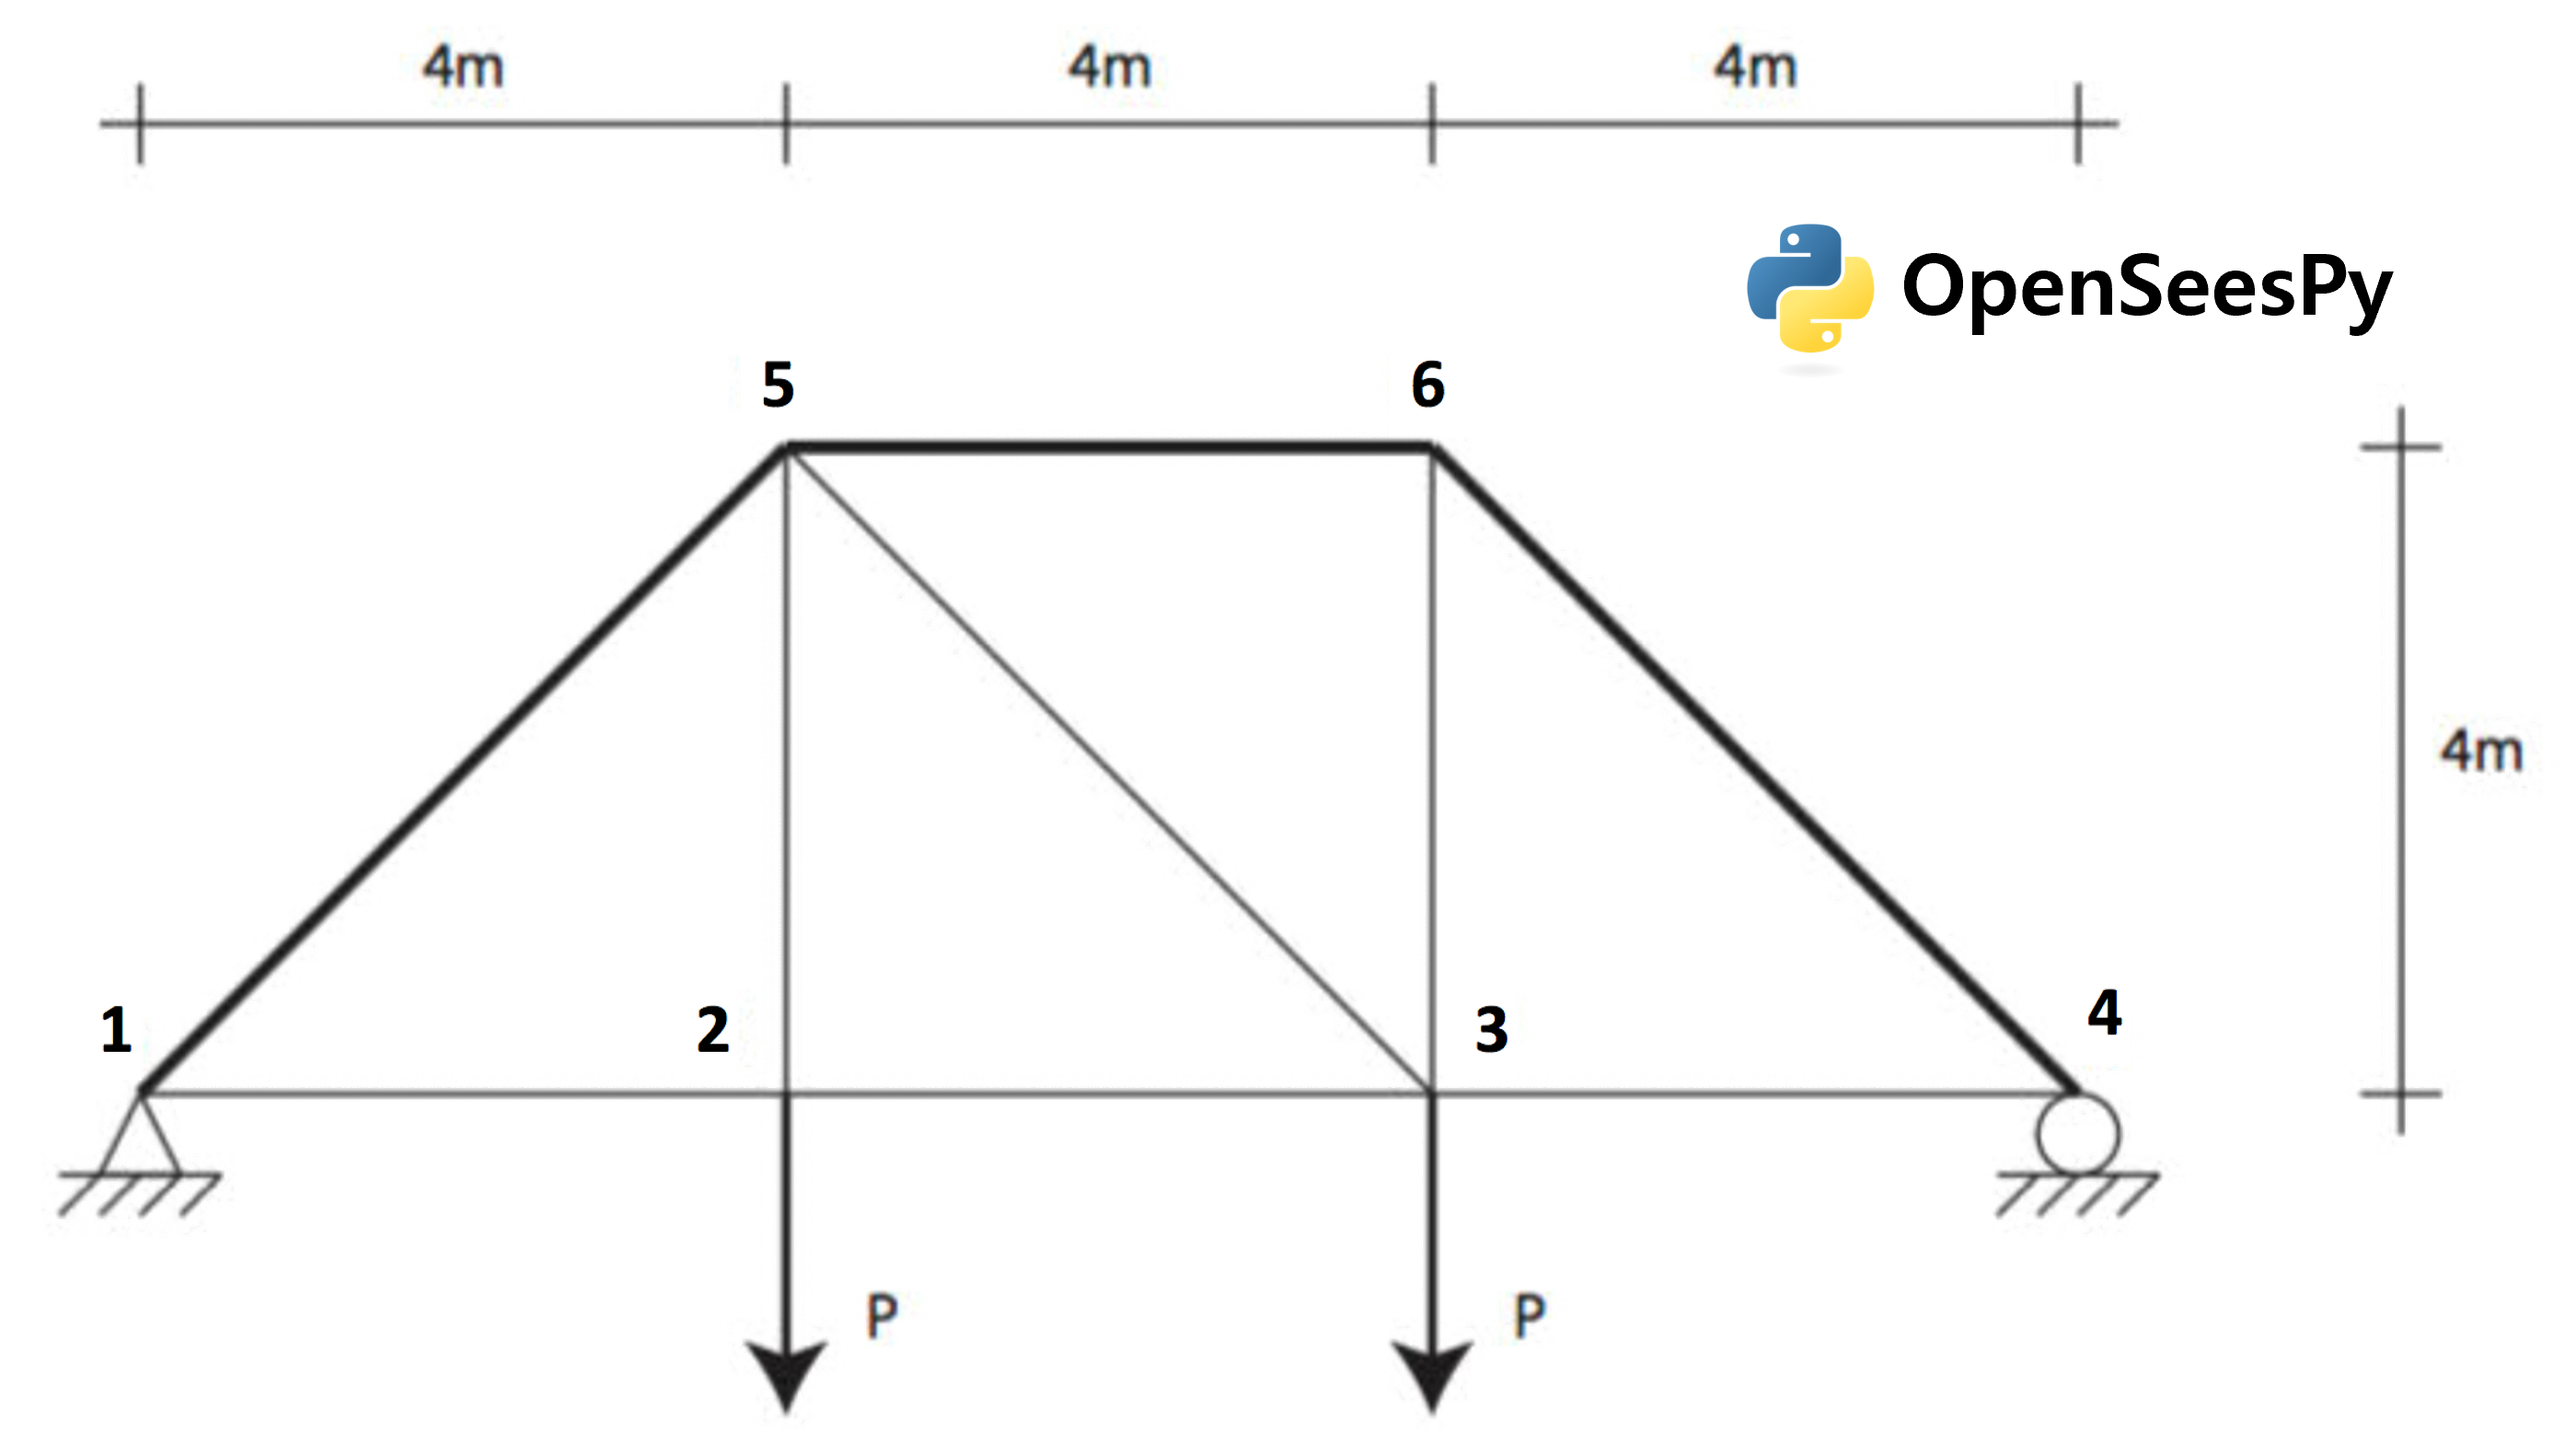
Consider the problem of uncertainty quantification in a two-dimensional truss structure shown in the following figure. Two input scripts are used to define a forward propagation procedure to be coordinated by quoFEM which will estimate the mean and standard deviation of the vertical displacement at node 3 using Latin hypercube sampling.
The following parameters are defined in the RV tab of quoFEM:
Elastic modulus,
E: Weibull distribution with a scale parameter \((\lambda)\) of \(210.0\), shape parameter \((k)\) of \(20.0\),Load magnitude,
P: Beta distribution with a first shape parameter \((\alpha)\) of \(2.0\), second shape parameter \((\beta)\) of \(2.0\), lower bound \((L_B)\) of \(20.0\), upper bound \((U_B)\) of \(30.0\),Cross-sectional area for the other six bars,
Ao: Lognormal distribution with a mean \((\mu)\) of \(250.0\), standard deviation \((\sigma)\) of \(50.0\),Cross-sectional area for the upper three bars,
Au: Normal distribution with a mean \((\mu)\) of \(500.0\), standard deviation \((\sigma)\) of \(100.0\),
5.2.1. UQ Workflow
To define the uncertainty workflow in quoFEM, select Forward Propagation for the Dakota Method Category, and enter the following inputs:
Method |
LHS |
Samples |
200 |
Seed |
949 |
5.2.2. Model Files
The following files make up the FEM model definition.
model.py: This file is a Python script which takes a given realization of the problem’s random variables, and runs a finite element analysis of the truss with OpenSeesPy. It is supplied to the Input Script field of the FEM tab, and obviates the need for supplying a Postprocess Script. When this script is invoked in the workflow, it receives the list of the identifiers supplied in the QoI tab through the operating system’s
stdoutvariable, and a set of random variable realizations by star-importing the Parameters File from the FEM tab.params.py: This file is a Python script which defines the problem’s random variables as objects in the Python runtime. It is supplied to the Parameters File field of the FEM tab. The literal values which are assigned to variables in this file will be varied at runtime by the UQ engine.
5.2.3. Results
The results from this analysis with a maximum of \(200\) iterations are as follows:
Node 3:
\(\mu = 7.6986\)
\(\sigma = 1.5666\)
Node 2:
\(\mu = 9.3967\)
\(\sigma = 1.8628\)
If the user selects Data in the RES tab, they will be presented with both a graphical plot and a tabular listing of the data. Various views of the graphical display can be obtained by left- and right-clicking the columns of the tabular data. If a singular column of the tabular data is selected with simultaneous right and left clicks, a frequency and CDF will be displayed.