5.5. Two-Dimensional Truss: Global Sensitivity Analysis using SimCenterUQ Engine
Problem files |
This example uses quoFEM to perform a global sensitivity analysis of an OpenSees FE model.
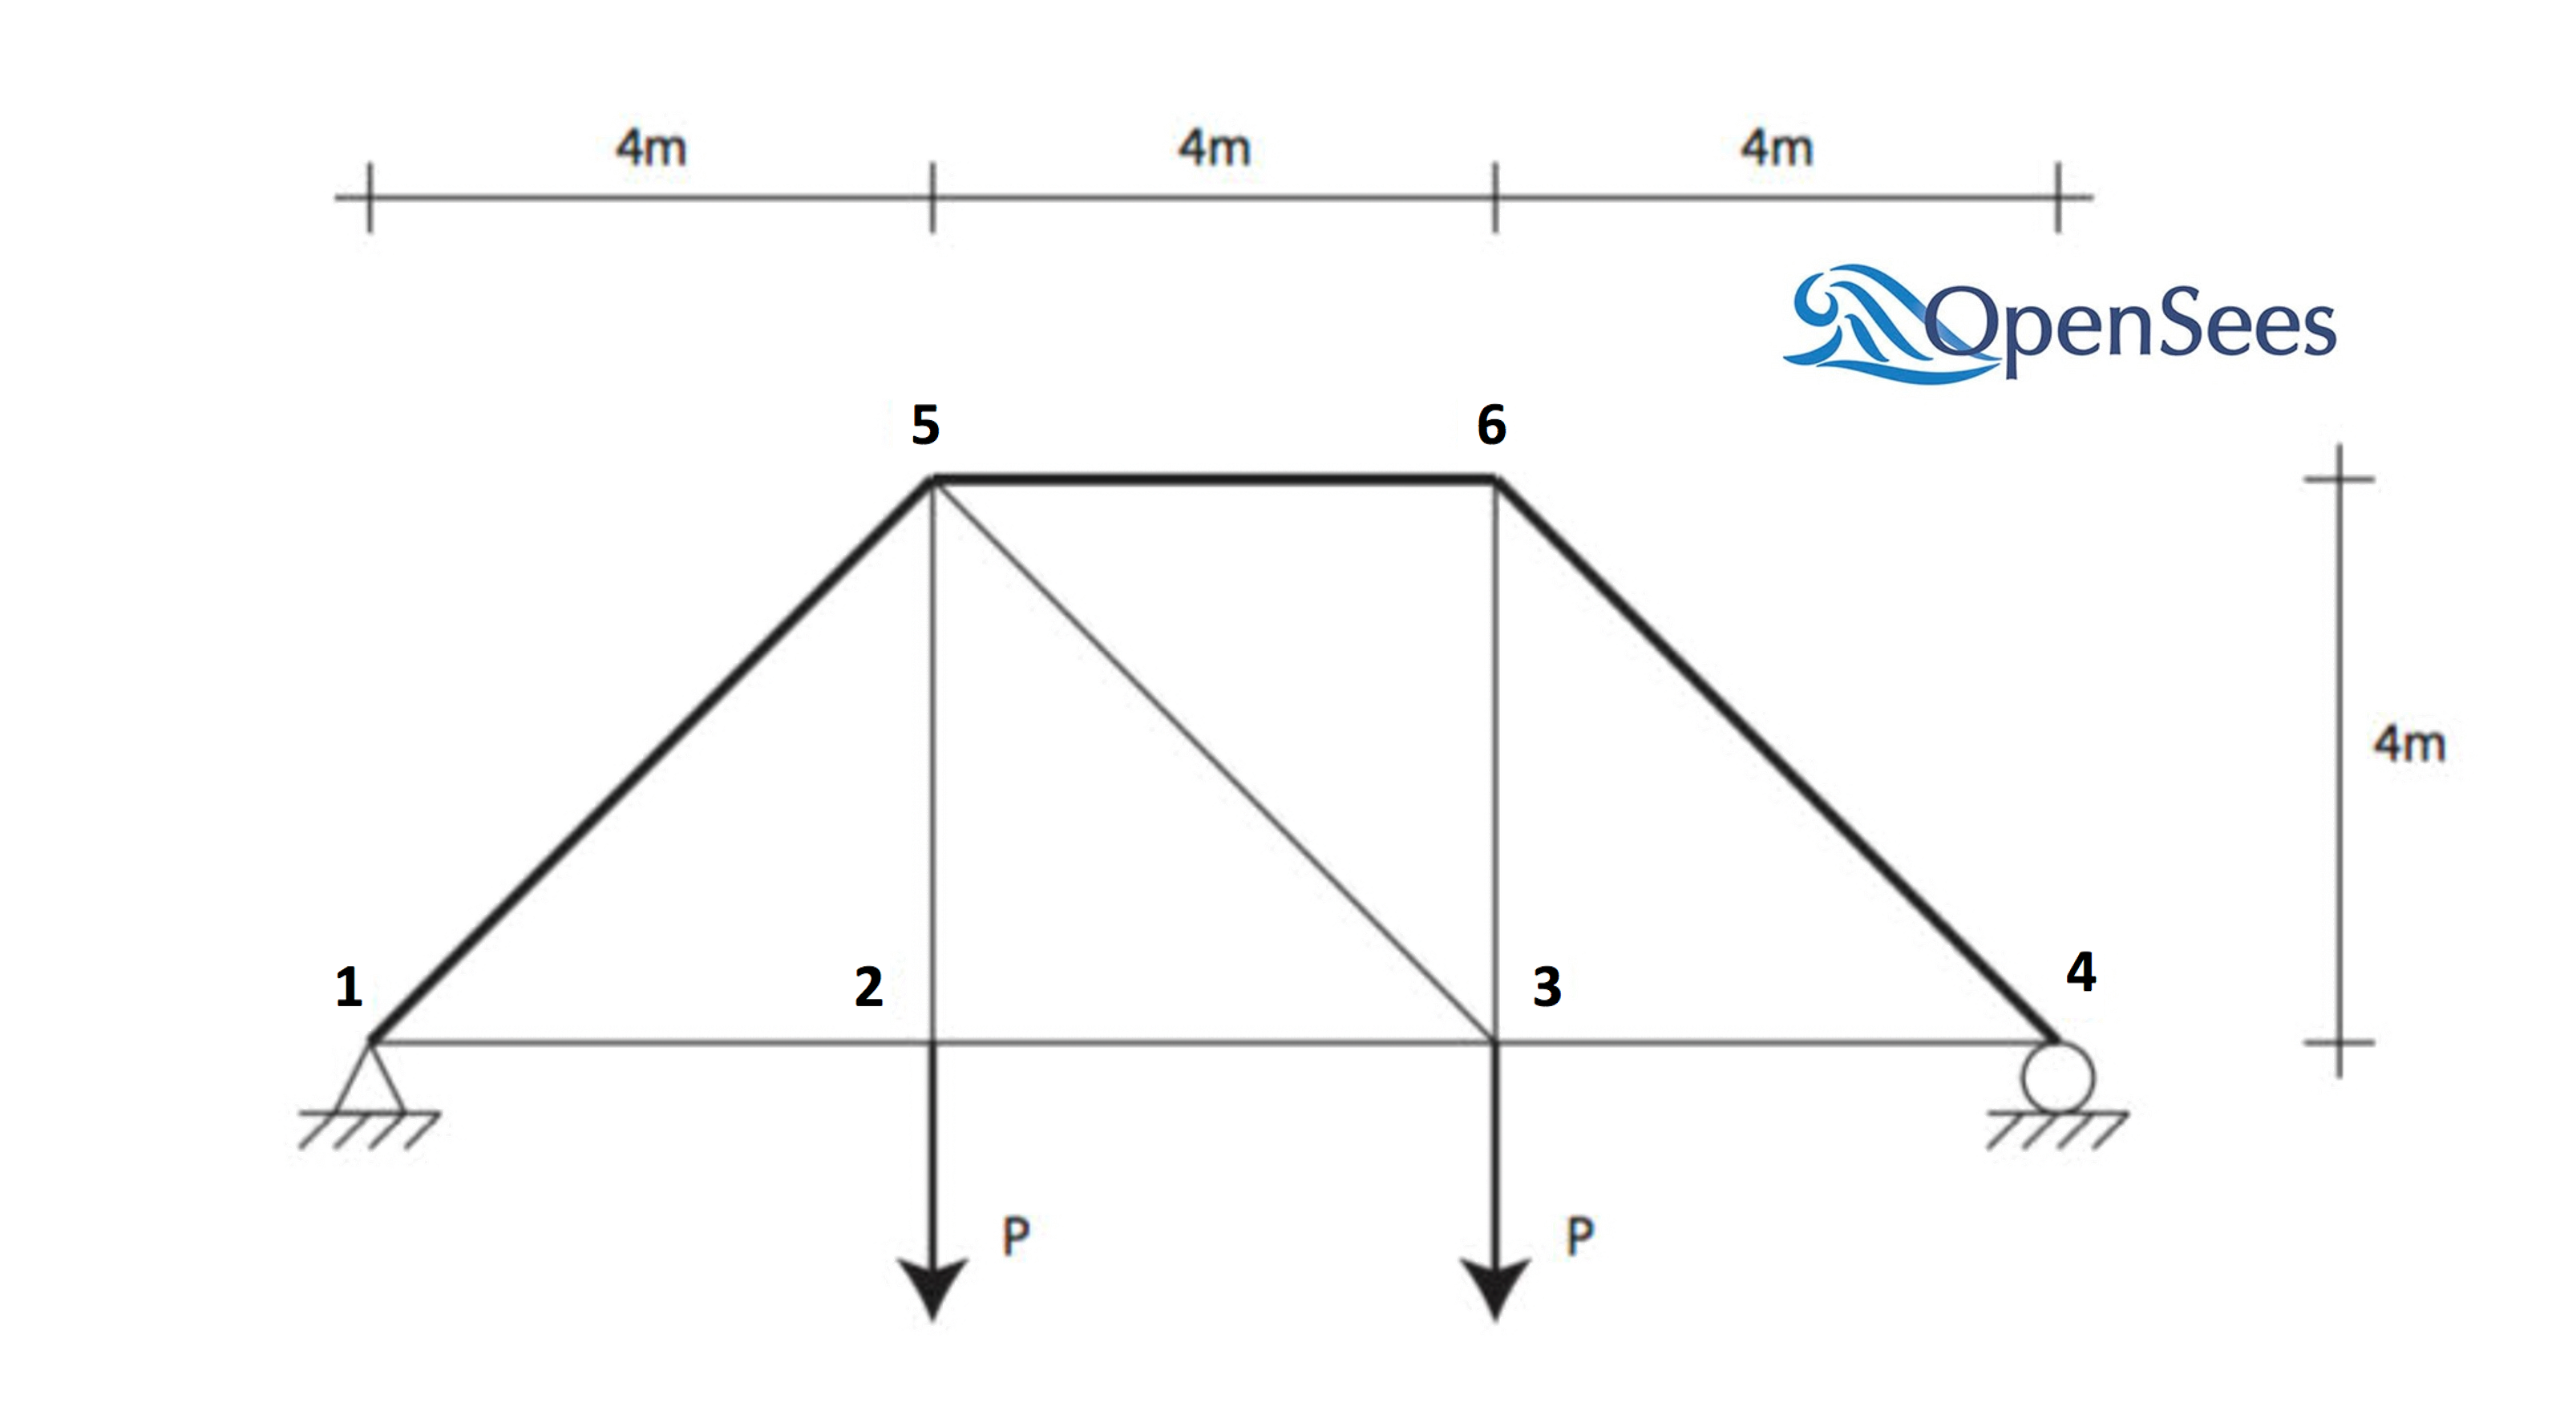
Consider a stochastic model of a two-dimensional truss structure like that shown in the following figure. A sensitivity analysis procedure is coordinated by quoFEM which will estimate the sensitivities of the response quantities of interest with respect to the problem’s random variables.
The following parameters are defined in the RV tab of quoFEM:
Elastic modulus,
E: Weibull distribution with a scale parameter \((\lambda)\) of \(210.0\), shape parameter \((k)\) of \(20.0\),Load magnitude,
P: Beta distribution with a first shape parameter \((\alpha)\) of \(2.0\), second shape parameter \((\beta)\) of \(2.0\), lower bound \((L_B)\) of \(20.0\), upper bound \((U_B)\) of \(30.0\),Cross sectional area for the other six bars,
Ao: Lognormal distribution with a mean \((\mu)\) of \(250.0\), standard deviation \((\sigma)\) of \(50.0\),Cross sectional area for the upper three bars,
Au: Normal distribution with a mean \((\mu)\) of \(500.0\), standard deviation \((\sigma)\) of \(100.0\),
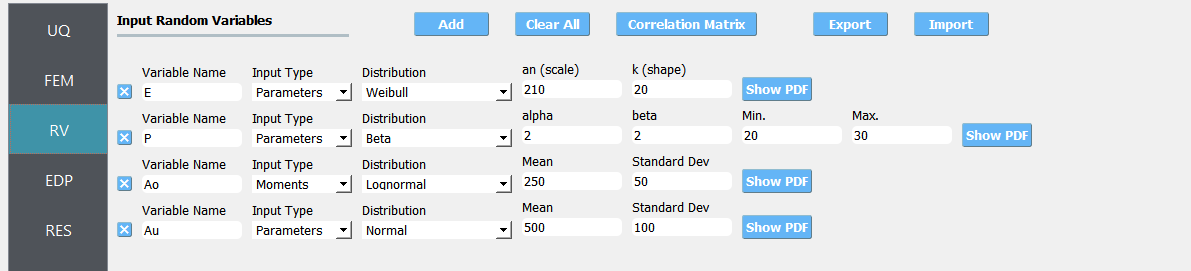
Fig. 5.5.1 Random variables for simple truss.

Fig. 5.5.2 Probability density function of E (press Show PDF button)
The vertical displacement at node 2 is considered as a response. It is specified in the QoI tab as Node_2_Disp_2.
5.5.1. UQ Workflow
To define the uncertainty workflow in quoFEM, select the SimCenterUQ engine and specify Sensitivity Analysis and Monte Carlo for the UQ Method Category and Method combination boxes, respectively. Finally, enter the following parameters for the remaining inputs.
Samples |
1000 |
Seed |
175 |
5.5.2. Model Files
The following files make up the FEM model definition.
TrussModel.tcl: This file is an OpenSees Tcl script that constructs and runs a finite element analysis of the truss for a given realization of the problem’s random variables. It is supplied to the Input File field of the FEM tab.
TrussPost.tcl: This file is an OpenSees Tcl script that processes the QoI identifiers supplied in the QoI tab, and writes the relevant response quantities to
results.outfrom an OpenSees process. It is supplied to the Postprocess File field of the FEM tab.
5.5.3. Results
Once the analysis is complete the RES panel will be automatically selected and the results will be displayed as shown in the following figure:
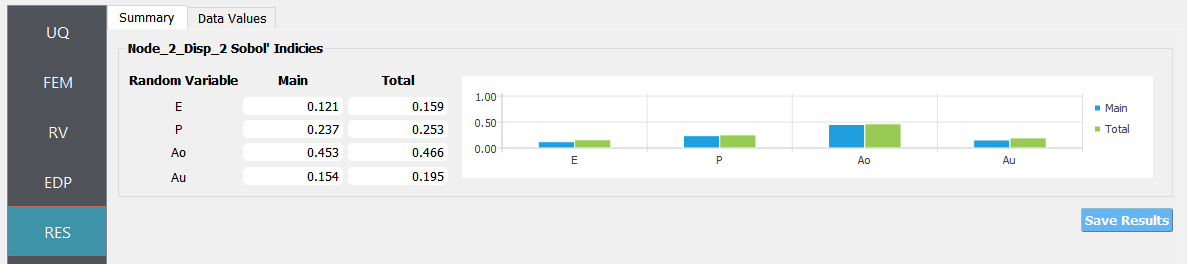
Fig. 5.5.3.1 Sensitivity analysis results for simple truss.
5.5.4. Comparison with Dakota engine
QuoFEM also supports MCS-based sensitivity analysis method offered in Dakota engine. In this section, the sensitivity analysis is conducted using different number of samples, and the results were compared with those from Dakota engine.
RV |
N=10 |
N=50 |
N=100 |
N=500 |
N=1000 |
|---|---|---|---|---|---|
E |
0.18 |
0.23 |
0.23 |
0.12 |
0.13 |
P |
0.60 |
0.36 |
0.29 |
0.24 |
0.25 |
Ao |
0.06 |
0.45 |
0.42 |
0.43 |
0.46 |
Au |
0.26 |
0.29 |
0.25 |
0.18 |
0.16 |
RV |
N=10 |
N=50 |
N=100 |
N=500 |
N=2000 |
|---|---|---|---|---|---|
(60) |
(300) |
(600) |
(3000) |
(12000) |
|
E |
0.06 |
0.17 |
0.18 |
0.12 |
0.13 |
P |
0.17 |
0.22 |
0.20 |
0.28 |
0.22 |
Ao |
0.19 |
0.41 |
0.52 |
0.46 |
0.47 |
Au |
0.03 |
0.12 |
0.23 |
0.20 |
0.18 |
In the current example, the probability model (PM) based approximation method in the SimCenterUQ engine converges faster within a smaller number of simulations. However, caution should be taken when using PM-based method. It is noteworthy that while the MCS method in the Dakota engine always converges to exact value when a sufficiently large number of simulations are involved, such asymptotic exactness is not guaranteed for the PM-based method. Still, the sensitivity rank between the variables is relatively robust.
5.5.5. Result with correlated inputs
Consider the case with correlated random variables. For example, below shows correlation matrix where the correlation between the variables Au and Ao are \(\rho=0.5\).
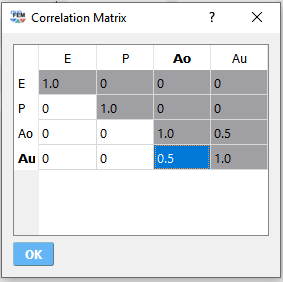
Fig. 5.5.5.1 Correlation matrix
The group-wise Sobol indices for {\(Au,Ao\)} can be defined at the QoI tab.

Fig. 5.5.5.2 Setting advanced options for group-wise Sobol indices
The results of sensitivity analysis:
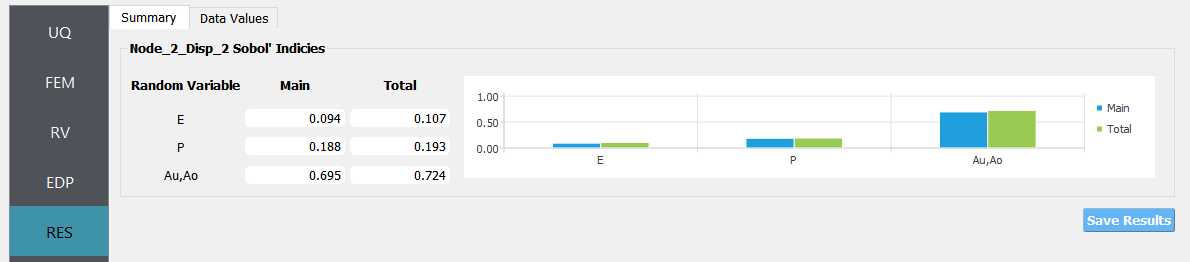
Fig. 5.5.5.3 Sensitivity analysis results for simple truss (with correlations)