1.1. Overview
The San Francisco Bay Area encompasses three large cities, San Francisco, Oakland, and San Jose, which together with the surrounding communities have a population of about 7.7 million people and accommodate a well-defined metro area with a blend of low-rise commercial (1-3 stories), industrial, high-rise hotels/casinos (over 20 stories), and single/multi-family residences. The seismic hazard in the San Francisco Bay Area is dominated by the San Andreas and Hayward faults that straddle the region. The San Andreas Fault is located just to the west of San Francisco and is capable of a magnitude Mw 8 earthquake, such as the Mw 7.8 event that occurred in 1906. The Hayward Fault, which runs up the eastern edge of the Bay Area, is capable of a magnitude Mw 7 earthquake, such as the Mw 6.7 event that occurred in 1868.
1.1.1. Rationale
This testbed for regional earthquake risk assessment of the San Francisco Bay Area under the Hayward Earthquake:
One of its intents is to demonstrate the computational scaffolding upon which community developers can progressively contribute refinements that increase the fidelity and capacities of the backend regional resilience assessment workflow.
The computational demand of this testbed is on the order of over \(10^5\) core hours (involving more than 40 M nonlinear time history analyses), which could help to test the scalability of the workflow and investigate potential optimizations.
In addition, this testbed exercises collecting and concatenating building information from various data sources.
During the course of developing this testbed, the USGS completed an earthquake scenario study for a Mw 7 event on the Hayward fault. Hence, this testbed also provides an opportunity to contrast existing regional assessment methods with the SimCenter’s computational workflow, based on which key limitations and future improvements could be identified.
1.1.2. Capabilities and Supported Hazards
The testbed supports the transition from census-block-level loss projections to asset-level projections that assess the damage to individual buildings under ground shaking. Supported building classes include residential, commercial and industrial construction, critical facilities, and manufactured homes, constructed of wood, steel, reinforced concrete, and masonry. The earthquake hazard is represented by the simulated ground motions for the Mw 7.0 Hayward earthquake ([Rodgers19]).
1.1.3. Current Implementation
For the initial implementation of the workflow, asset description adopts an augmented parcel approach that enriches tax assessor data. Finite difference models are employed to simulate three-component seismograms. In lieu of a structural analysis model, assets are assigned attributes associated with various HAZUS-consistent building classifications. The story-based damage and loss fragility models are derived from corresponding building-level damage and loss functions from the HAZUS earthquake methodology ([FEMA18]). This documentation specifically demonstrates the process of: (1) asset description, (2) hazard characterization, (3) asset representation, and (4) damage and loss modeling. Sample results are presented to demonstrate the usage of the workflow.
1.1.4. Available Inventories
Three different building inventories have been developed for the Atlantic County testbed and can be accessed on DesignSafe.
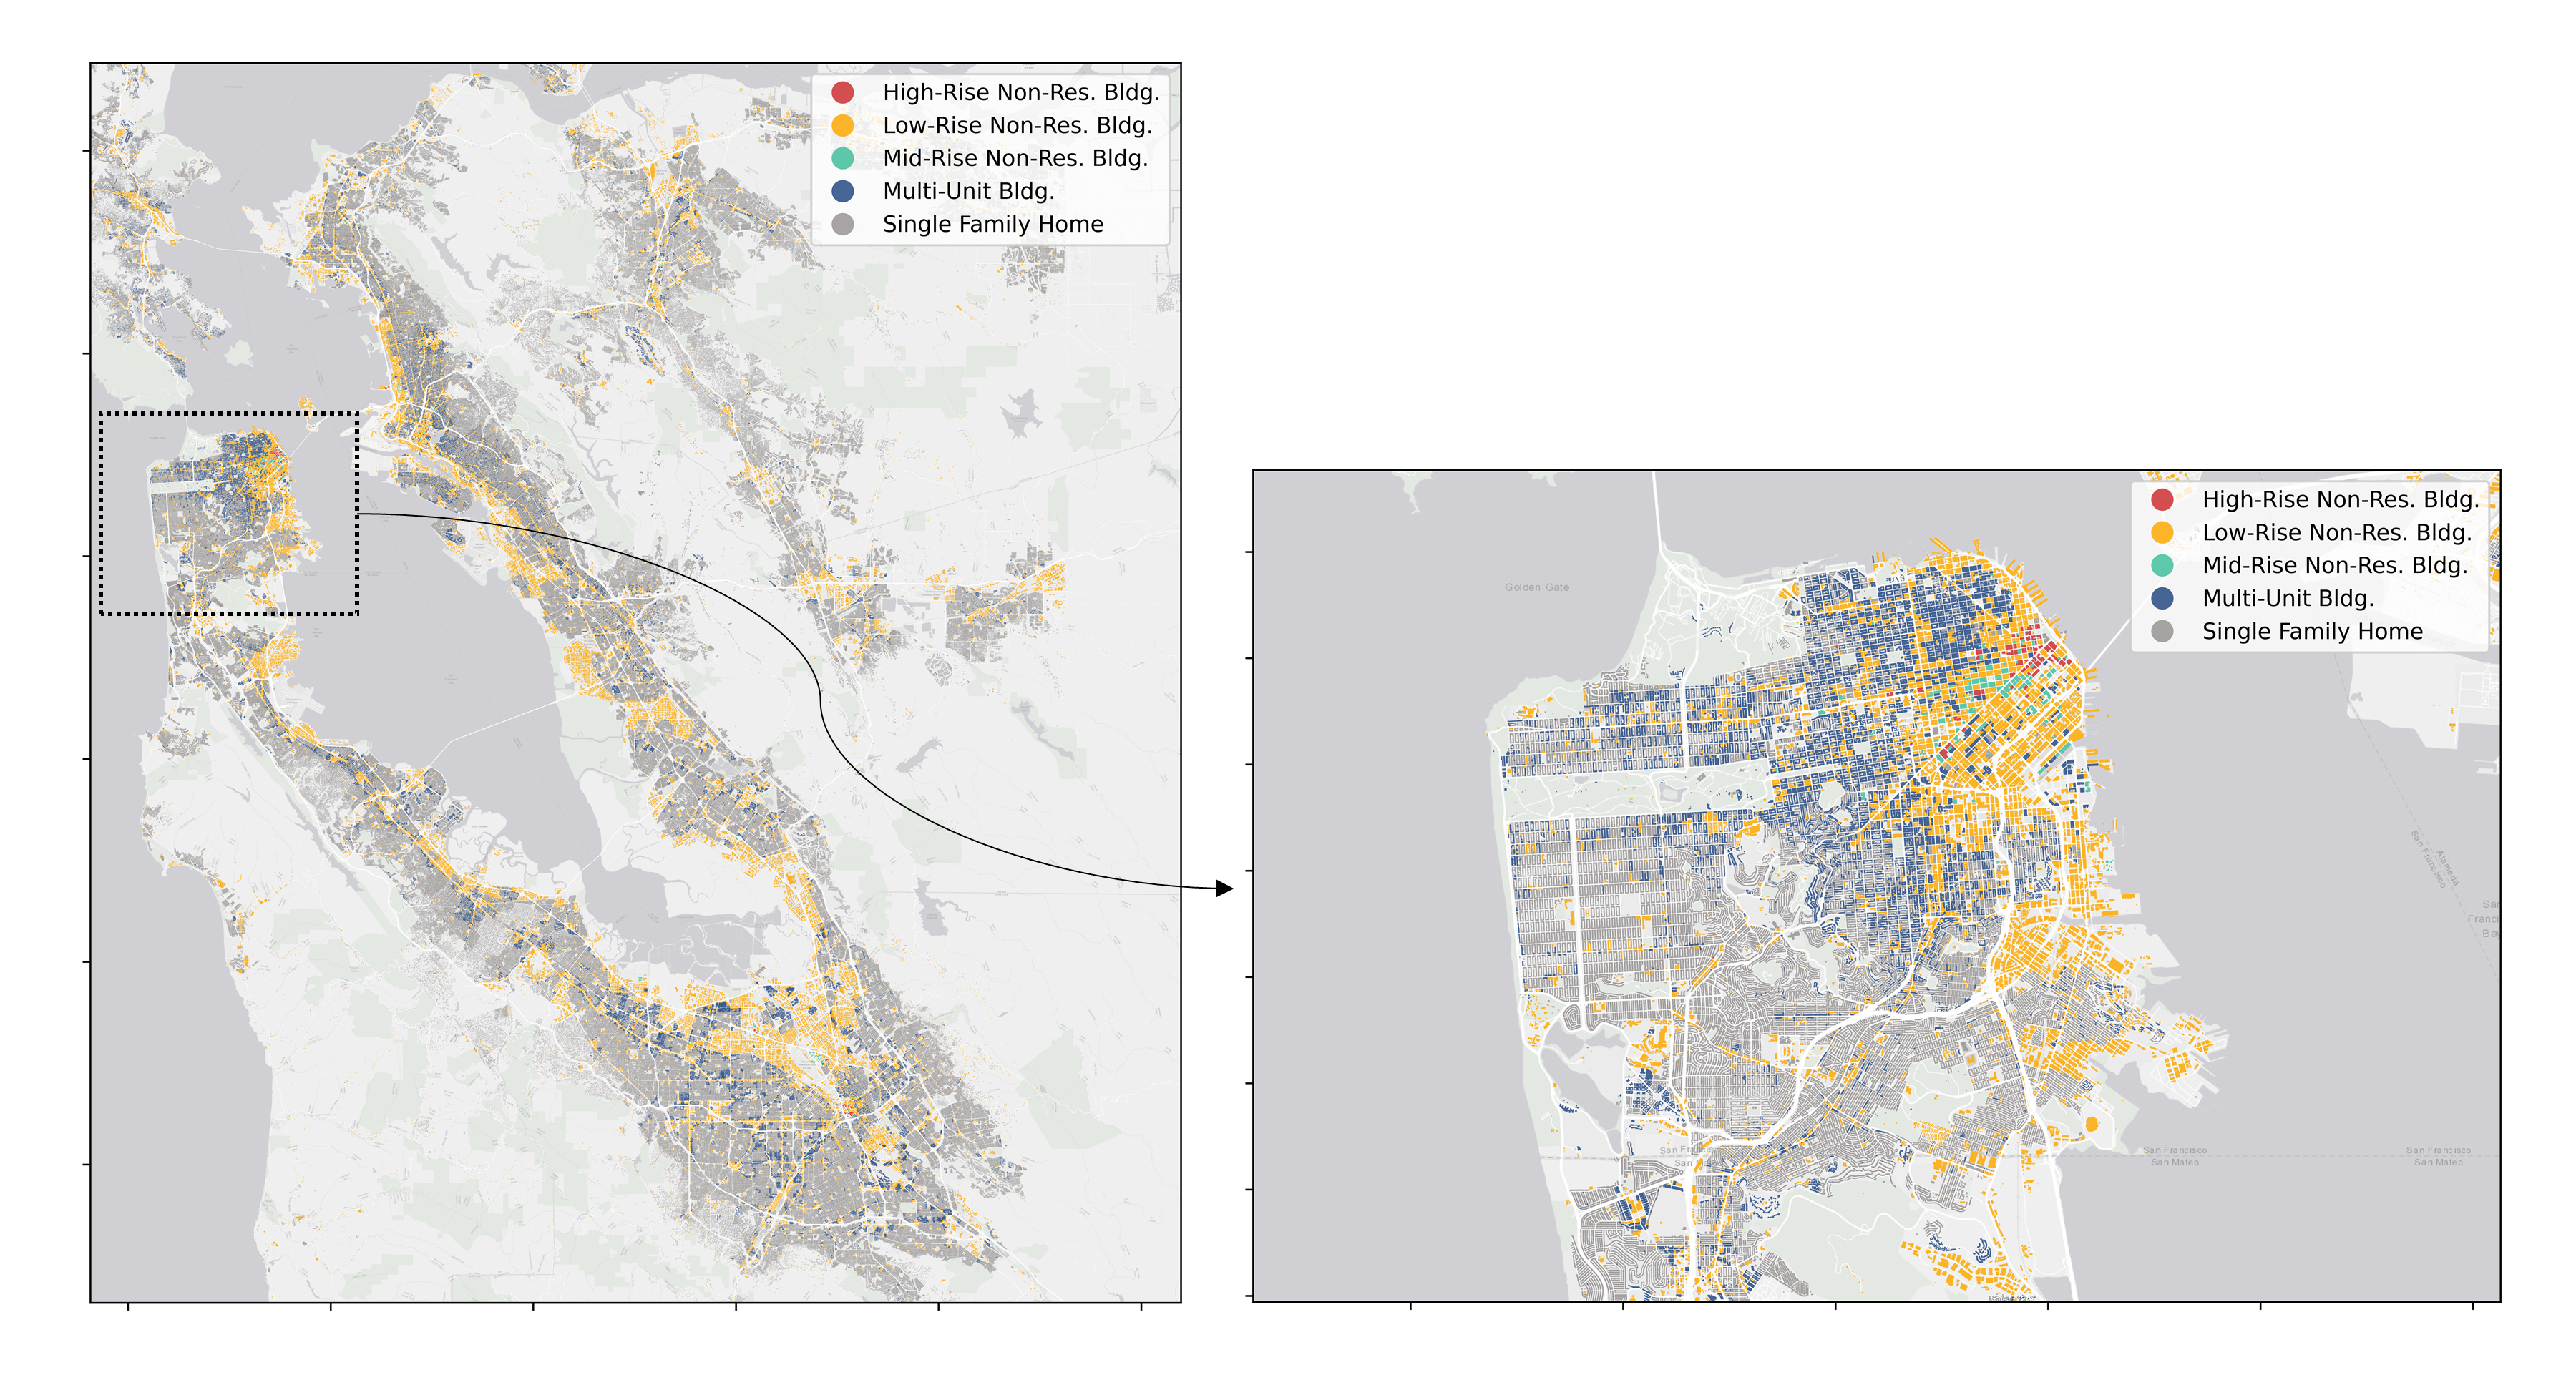
San Francisco Bay Area Inventory: Full inventory of 1.84 M buildings in San Francisco Bay Area, described based on a variety of data sources (Fig. 1.1.4.1).

Fig. 1.1.4.1 Geospatial visualization of subclasses of buildings in San Francisco Bay Area.
Alameda Inventory: To be added
San Francisco Tall Building Inventory: To be added
The following figures summarize characteristics of these inventories, including distribution by year built (Fig. 1.1.4.2), by occupancy (Fig. 1.1.4.3), by number of stories (Fig. 1.1.4.4) and by primary construction material (Fig. 1.1.4.5). Notably, the inventories are typified by older vintages of construction (76% of the buildings were constructed before 1980), with a dominance of low-rise (1-2 stories), residential, wood construction (approximately 93% of San Francisco Bay Area buildings). Steel and reinforced concrete constructions are more prevalent in downtown San Francisco, Oakland, and San Jose.

Fig. 1.1.4.2 Distribution of year built for buildings.

Fig. 1.1.4.3 Distribution of occupancy types.

Fig. 1.1.4.4 Distribution of total story numbers for buildings.

Fig. 1.1.4.5 Distribution of primary construction material types.
Rodgers, A. J., Petersson, N. A., Pitarka, A., McCallen, D. B., Sjogreen, B., and Abrahamson, N. (2019). Broadband (0-5 Hz) Fully Deterministic 3D Ground-Motion Simulations of a Magnitude 7.0 Hayward Fault Earthquake: Comparison with Empirical Ground-Motion Models and 3D Path and Site Effects from Source Normalized Intensities. Seismol. Res. Lett. 90:17.
FEMA (2018), HAZUS – Multi-hazard Loss Estimation Methodology 2.1, Earthquake Model Technical Manual, Federal Emergency Management Agency, Washington D.C.