1.6. Uncertainty Quantification
Multiple sources of uncertainty are considered in this testbed, including the uncertainty in asset representation, hazard characterization, and damage and loss assessment. For these uncertainty sources, different strategies were implemented in the workflow to quantify their influence. The following sections will introduce the details of each component.
1.6.1. In Hazard Characterization
Given a specific earthquake scenario, there are two different sources of uncertainty for site peak ground acceleration: (1) the uncertainty induced by possible different epicenters, rupture propagations, soil velocity models, or local soil properties (which is usually termed epistemic uncertainty); and (2) the inherent variation in observing the random events at the site (which is usually termed as aleatory uncertainty). Both these two uncertainty sources can be taken into account in the introduced workflow.
For epistemic uncertainty, multiple scenarios can be simulated for a given earthquake scenario. For the aleatory uncertainty, this workflow adapts a nearest-neighbors method to propagate uncertainty through the workflow, as illustrated in Fig. 1.6.1.1. The ground motions are processed from SW4 on a prescribed grid, and for each selected asset location (red square dot), the workflow randomly selects 25 samples of the ground motions from the 4 nearest neighbors (yellow circles). Note this random sampling is performed along with the multiple realizations from the epistemic uncertainty quantification, so the two uncertainty sources are considered simultaneously. Note the ground motions at one building site from the nearest grid points can be repeated as these 25 samples are also intended for considering the structural modeling uncertainty (i.e., stiffness and damping parameters in the next section).
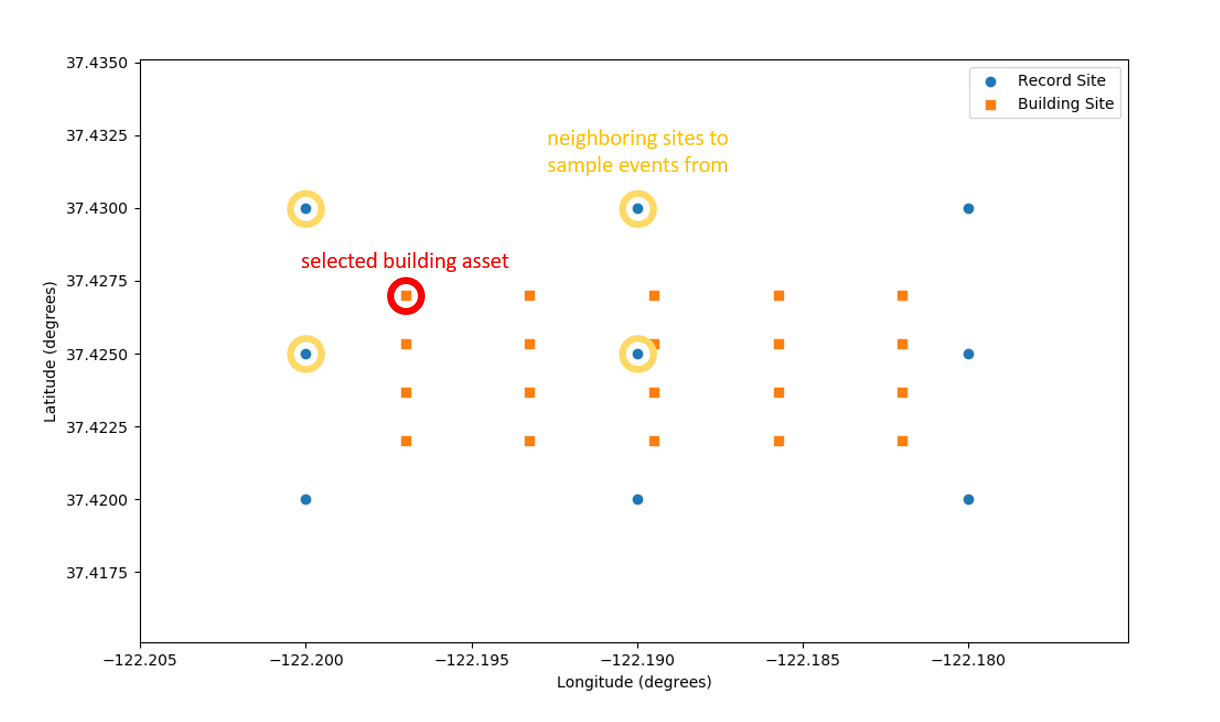
Fig. 1.6.1.1 Nearest-neighbors method for sampling site hazard uncertainty.
1.6.2. In Structural Response Simulation
The approximations and uncertainties in the structural model and behavior are considered by treating the initial stiffness and the damping ratio as random variables with a 0.1 coefficient of variation. These uncertainties are propagated through the analysis using different realizations of the stiffness and damping parameters for each of the 25 non-linear dynamic analyses for each building.
1.6.3. In Damage and Loss Assessment
The testbed implemented pelicun <https://pelicun.readthedocs.io/en/latest/index.html> (Probabilistic Estimation of Losses, Injuries, and Community resilience Under Natural disasters) to quantify damage (damage states) and loss (in the form of decision variables, e.g., loss ratio). The dispersion in the simulated drift and acceleration demands is inflated by 0.22 to account for additional modeling uncertainties not considered in the non-linear dynamic analyses. Specifically, 20,000 realizations of damage and losses for each building are calculated. As described in Damage and Loss Estimation, the damage models are continuous functions (lognormal distribution functions) conditional on EDP. Hence, the damage state and corresponding loss ratio of an asset follow probabilistic distributions, considering all uncertainty as discussed above that can influence the building’s performance.