4. Examples
The following examples highlight the usage of R2D. The files for the examples are available on GitHub. The examples can also be downloaded and installed within the tool by going to the menu Examples -> Manage Examples and by checking the boxes of the examples that are desired.
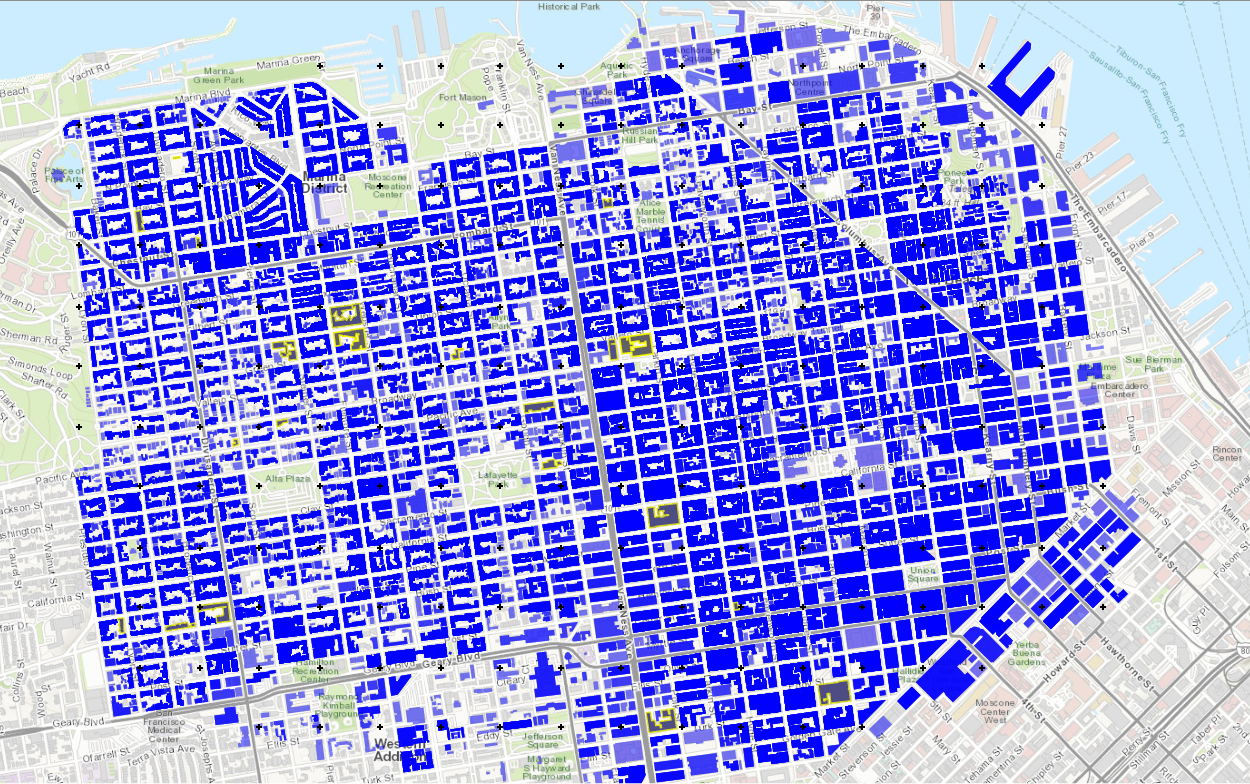
This earthquake example demonstrates rapid analysis capabilities with the HAZUS earthquake damage and loss assessment methodology. Building-level Damage and Losses (D&L) are calculated directly from Intensity Measures (IM) for 25 assets. The IM field that represents peak ground acceleration in the city of San Francisco, CA, from an Mw7.2 event on the San Andreas fault, was obtained from Probabilistic Seismic Hazard Analysis (PSHA).
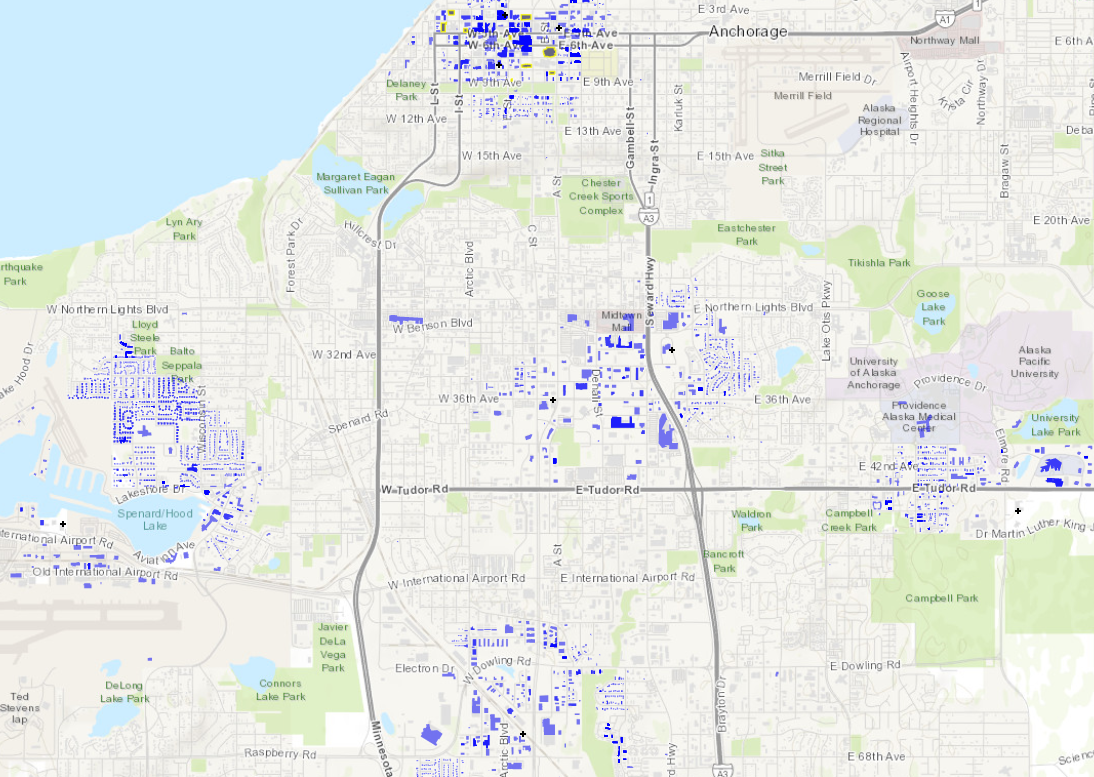
This example uses ground motions from the 2018 earthquake in Anchorage, AK, to characterize the response of buildings with an idealized MDOF building model through story-level Engineering Demand Parameters (EDP). Exploiting the refinement in EDPs, a HAZUS-based story-level assessment is employed to evaluate the performance of 510 buildings.
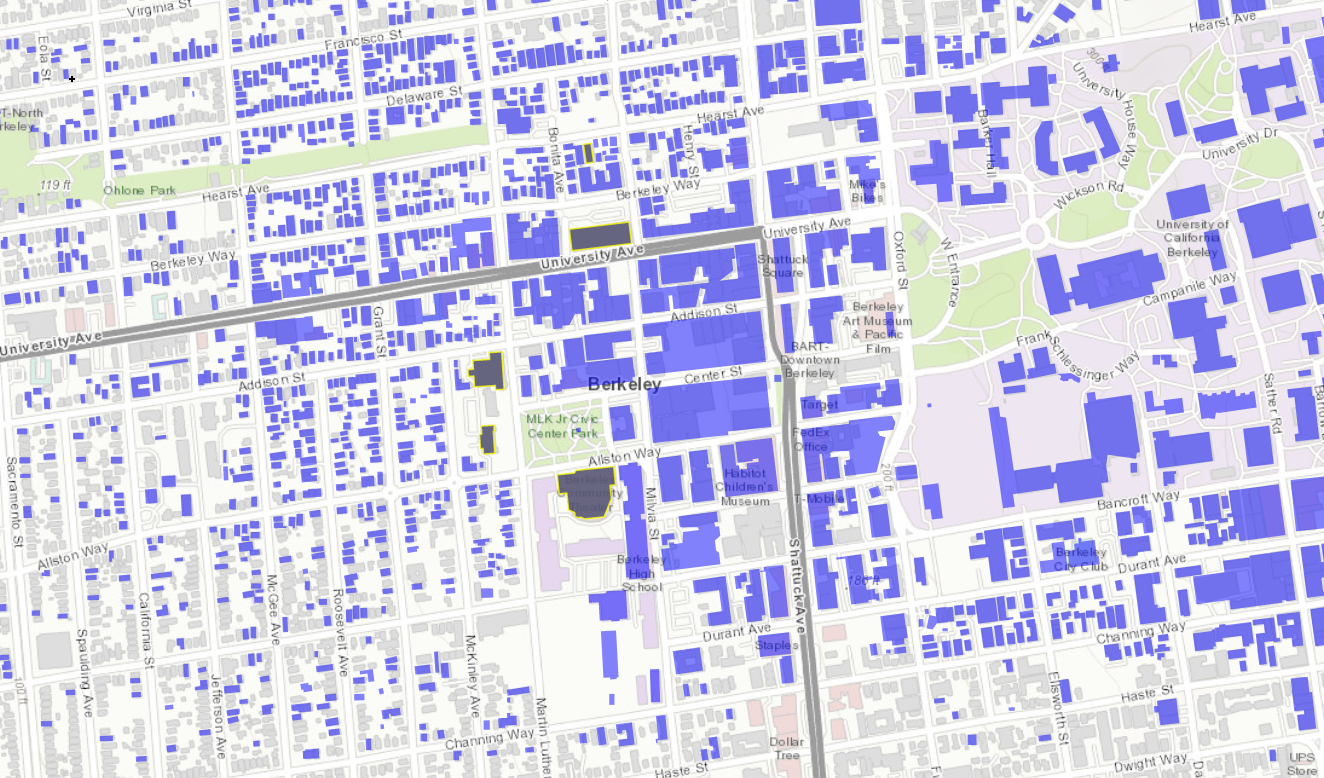
This example features ground motion acceleration time histories simulated using the SW4 software and a detailed geophysical model of the San Francisco Bay Area by the Lawrence Livermore National Laboratory. The ground motions are used to investigate the impact of a Mw7.0 earthquake on the Hayward fault on the city of Berkeley. Engineering Demand Parameters are simulated with an idealized MDOF building model; building performance is evaluated at the story-level based on the HAZUS earthquake damage and loss assessment methodology.
This example highlights the use of R2D for advanced response estimation leveraging information provided through a building inventory. A template script is provided that creates a building-specific cantilever and performs the response-history analysis to obtain EDPs and the hazard is generated using empirical ground motion records from the PEER NGA West2 database.
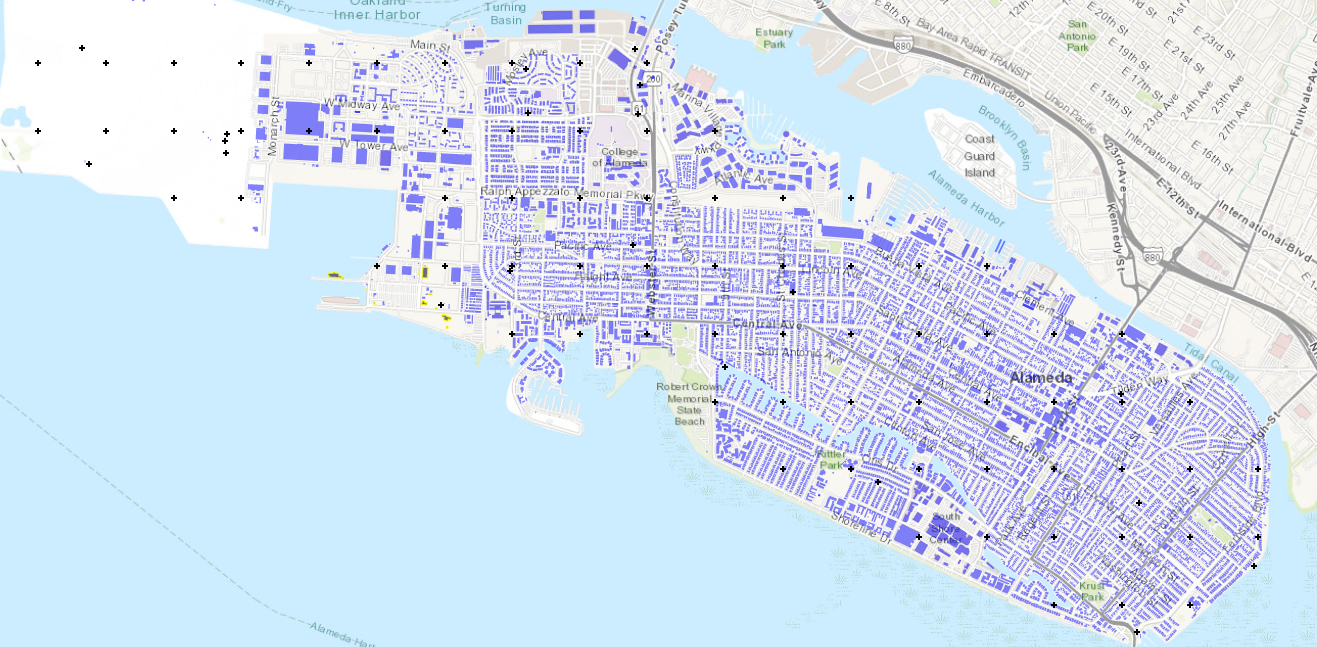
This example presents a coupled damage assessment for ground shaking and liquefaction hazards. To infer liquefaction, estimates of horizontal spreading and vertical settlement are generated from PGA values obtained through PSHA. These three intensity measures form the basis of input to a building-level, HAZUS-based damage and loss assessment that accounts for potential collapses due to liquefaction. Approximately 14,000 buildings are considered in the city of Alameda, CA.
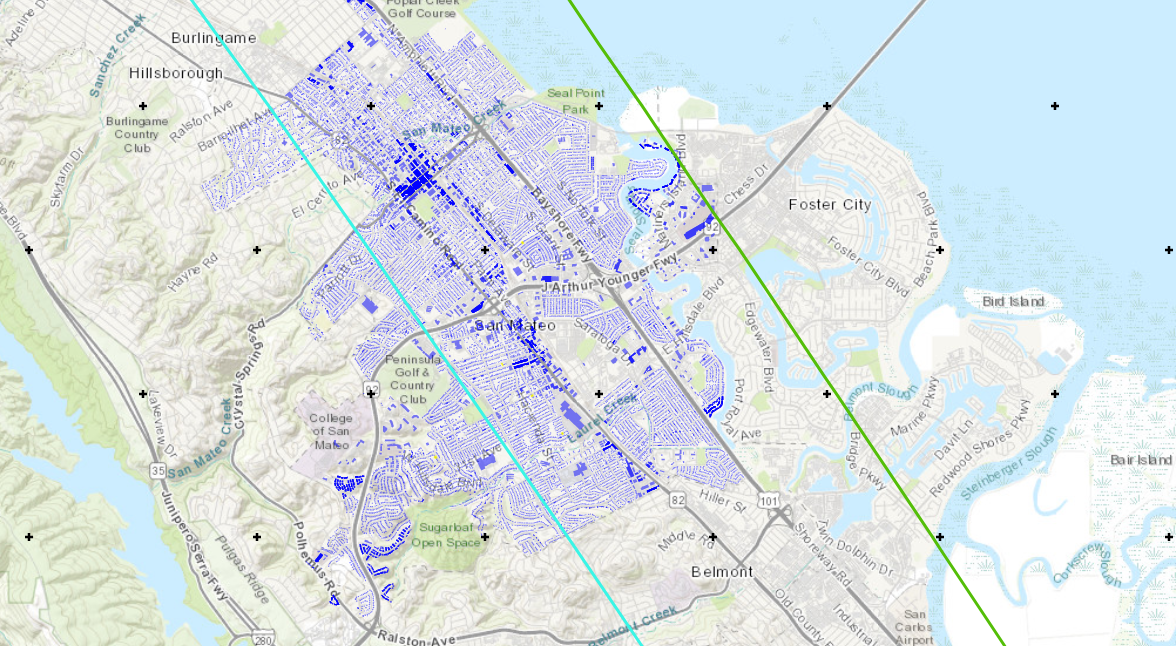
This example presents a building loss assessment given a USGS ShakeMap as input. The Mw7.8 Scenario Earthquake - North San Andreas + North Coast + Peninsula + Santa Cruz Mountain (shakemap_id=npsanandreassansapsasm7p8_se) is employed in this example. Approximately 21,000 buildings are considered in the city of San Mateo, CA.
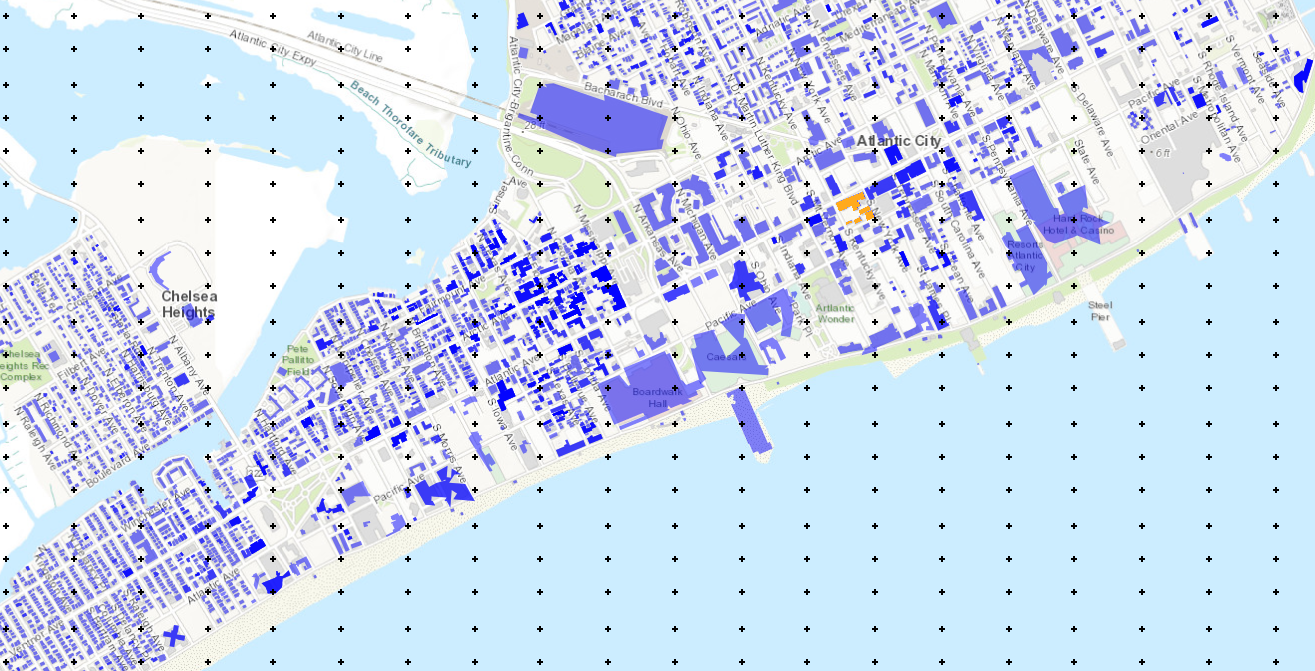
This example presents a damage and loss assessment for buildings under wind and water inundation hazards from a hurricane. Approximately 6,600 buildings with various occupancy types and construction materials are considered in Atlantic City, NJ, with specified rulesets for determining key building characteristics. A Category 5 intensity hurricane with 3-s gust peak wind speeds, obtained from the Storm Hazard Projection Tool (NJCoast project), is employed with HAZUS-Hurricane wind fragility functions to estimate building damage states and loss ratios. The peak wind speeds are calculated using a linear analytical model for the boundary layer winds (Snaiki and Wu, 2017), and the peak inundation heights are calculated from a surrogate model (Jia and Taflanidis, 2013).
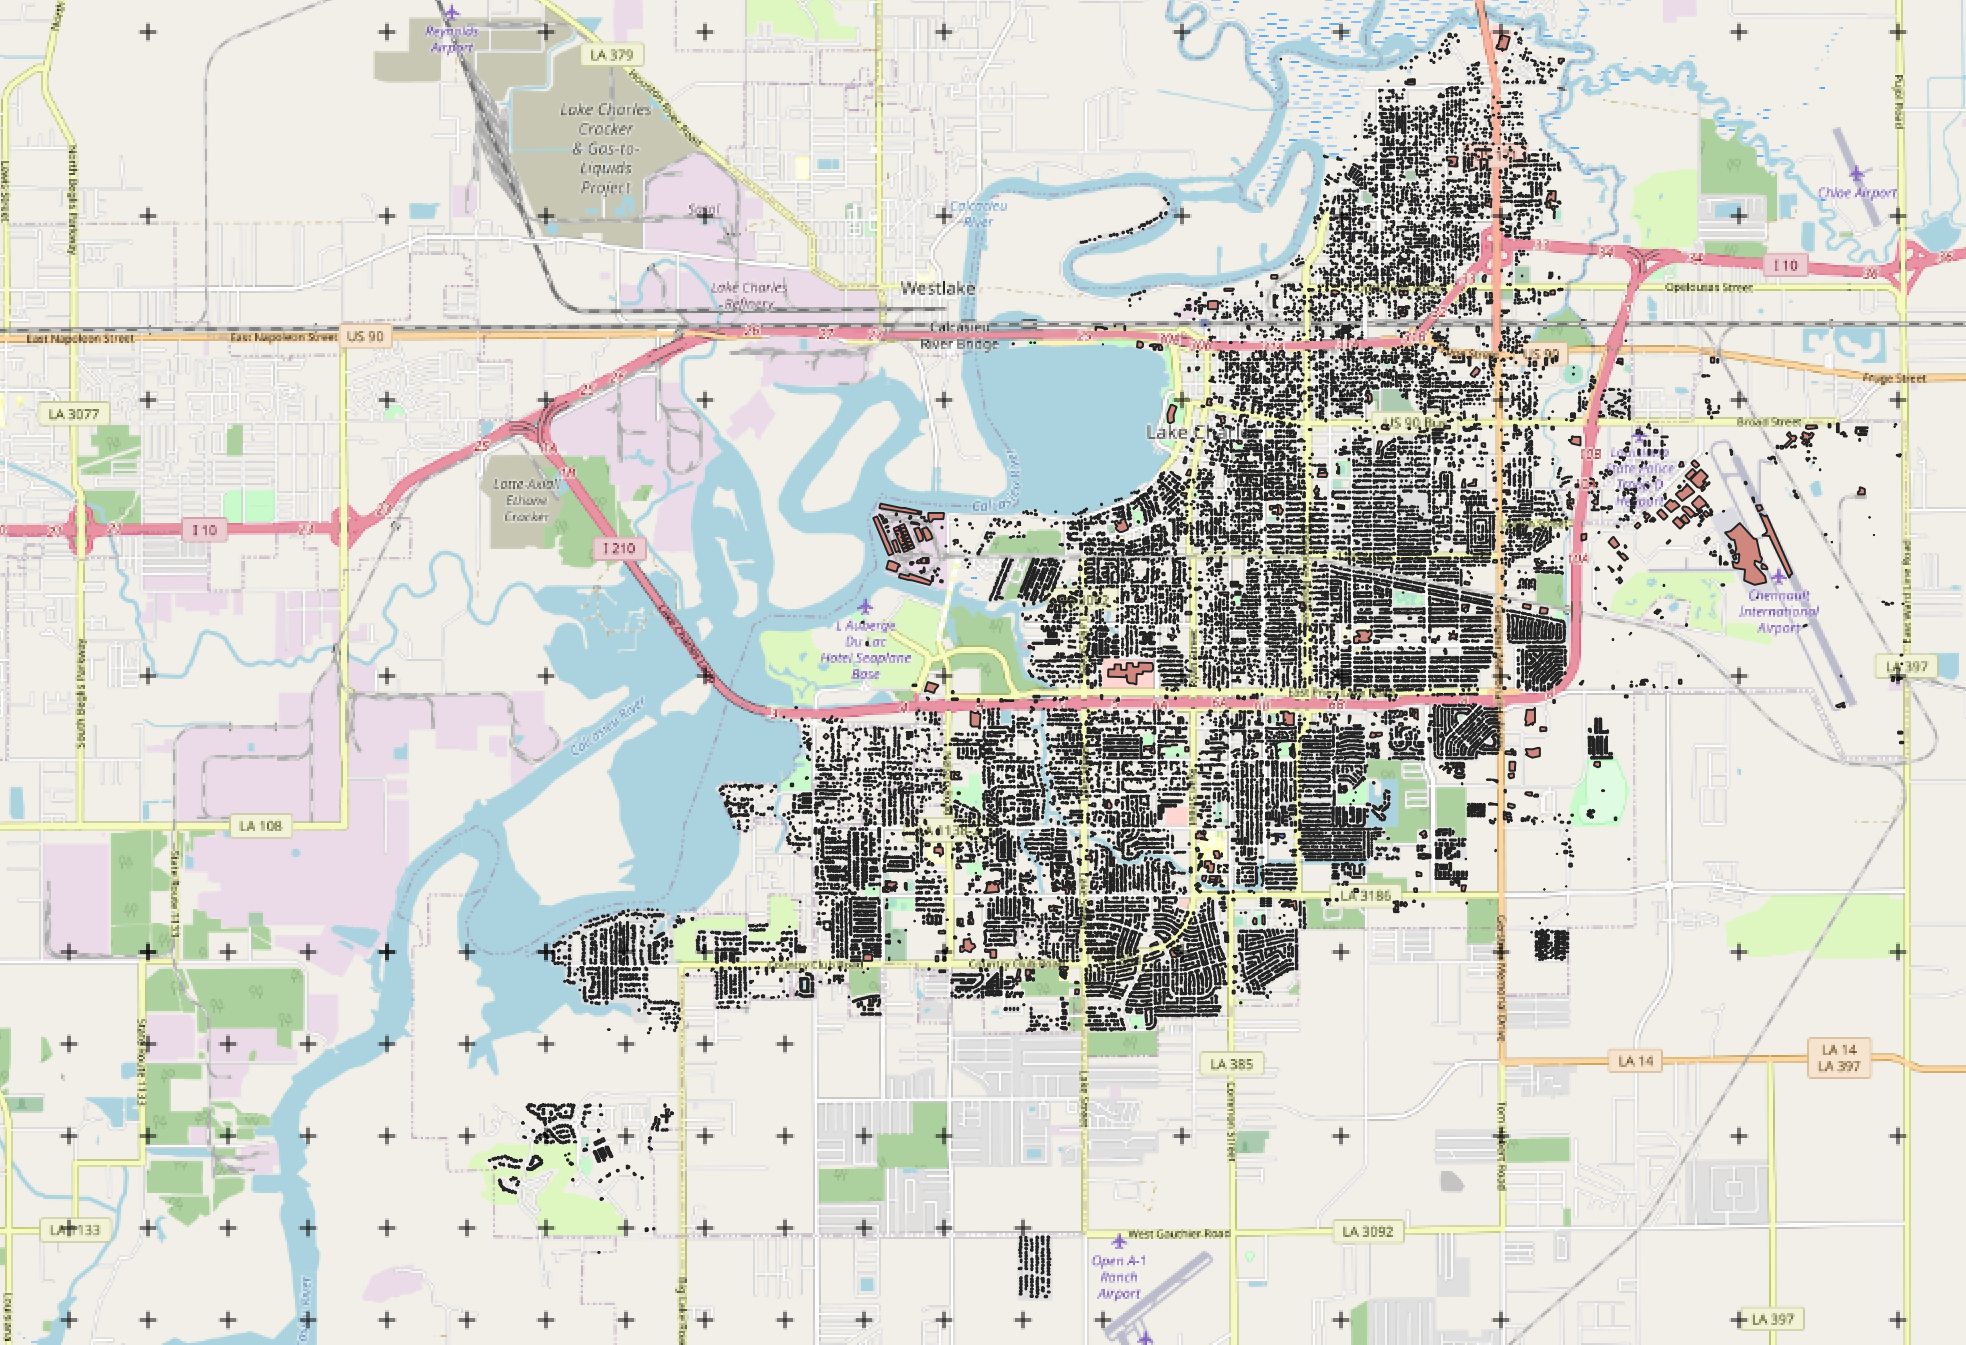
Hurricane Laura made landfall as a strong Category 4 storm near Cameron, LA in the early hours of 27 August 2020, tying the Last Island Hurricane of 1856 as the strongest land-falling hurricane in Louisiana history. This example presents a wind-induced damage assessment for Lake Charles, LA. Peak wind speed data of Hurricane Laura from Applied Research Associates, Inc. is used as intensity measure, inventory data of about 26,000 wood residential buildings is used along with the rulesets developed tp map the inventory to HAZUS-type damage assessment. Final results include the damage and loss estimations along with the building information models based on the rulesets.
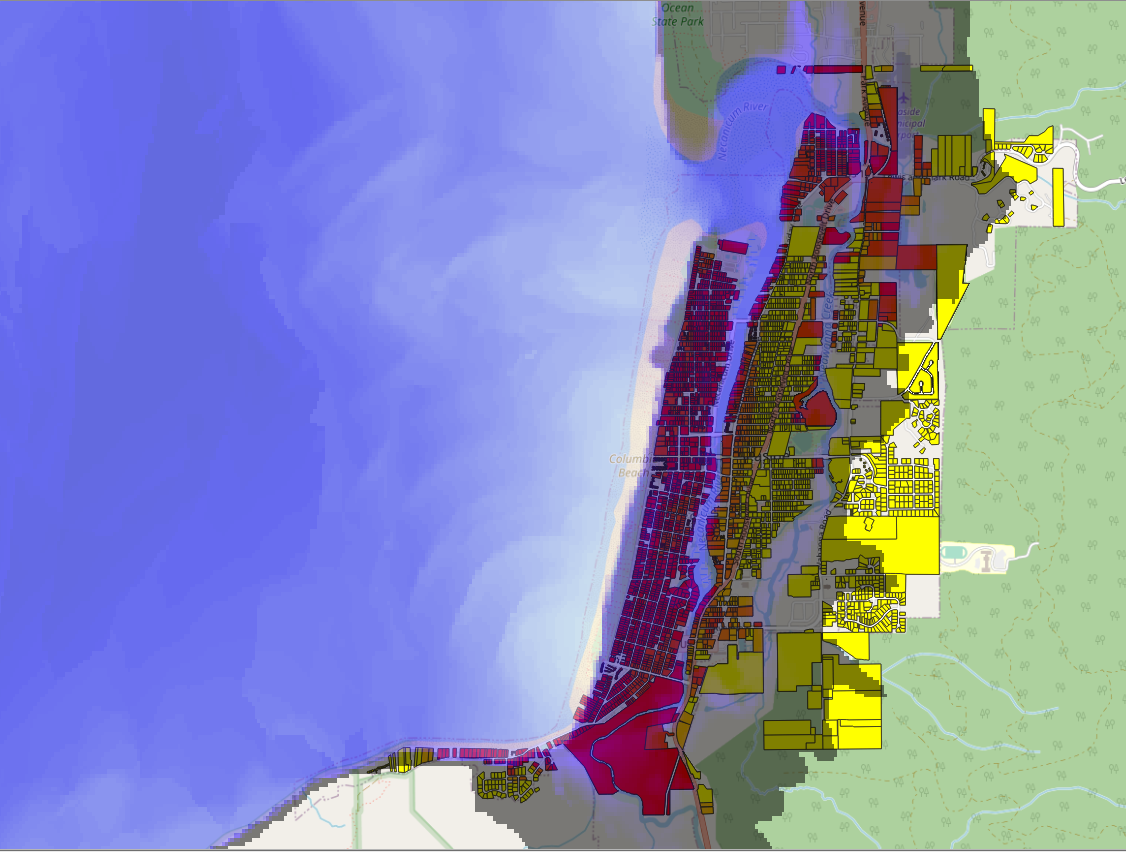
The Cascadia Subduction Zone (CSZ) separates the Juan de Fuca and North America plates, stretching approximately 1,000 km between California and British Columbia, Canada. A rupture of the CSZ may result in a megathrust earthquake and a subsequent tsunami. This example considers a tsunami event in the city of Seaside, located along the northern Oregon coast. A highlight of this example is that it shows how user-provided fragility functions are employed in the SimCenter workflow. The building inventory consists of 4744 buildings of different types and construction materials. For the tsunami hazard, the results of a Probabilistic Seismic-Tsunami Hazard Analysis (PSTHA; Park et. al. 2017), with a recurrence interval of 500 years, is employed. The building inventory, tsunami hazard raster, and building fragility functions are all from the Seaside testbed, made available by the Center of Excellence for Risk-Based Community Resilience Planning (CoE) as part of their Interdependent Networked Community Resilience Modeling Environment (IN-CORE) platform. They can be accessed online on the IN-CORE Web Tools website (https://incore.ncsa.illinois.edu/doc/incore/webtools.html).
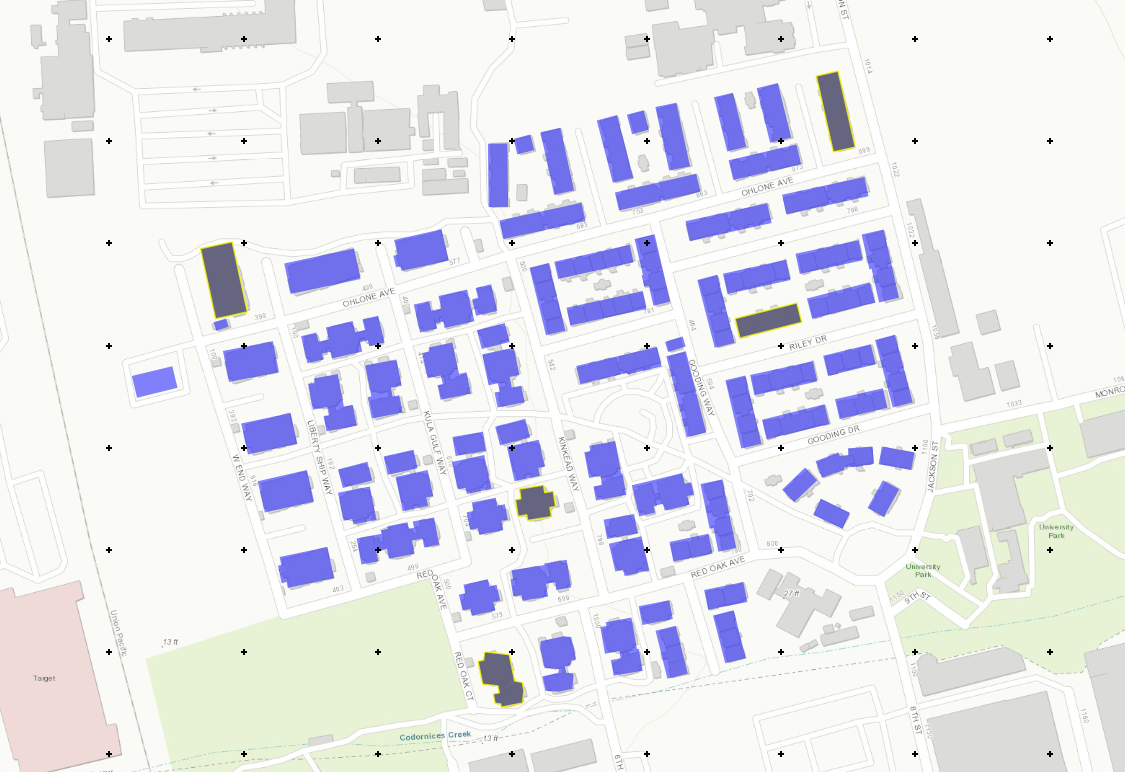
This example presents regional earthquake impact analysis including site response analysis and building damage and loss assessment. Overall 177 sites are included for soil response simulation under bedrock ground motion input with a building inventory including approximately 14,000 buildings in the city of Alameda, CA.
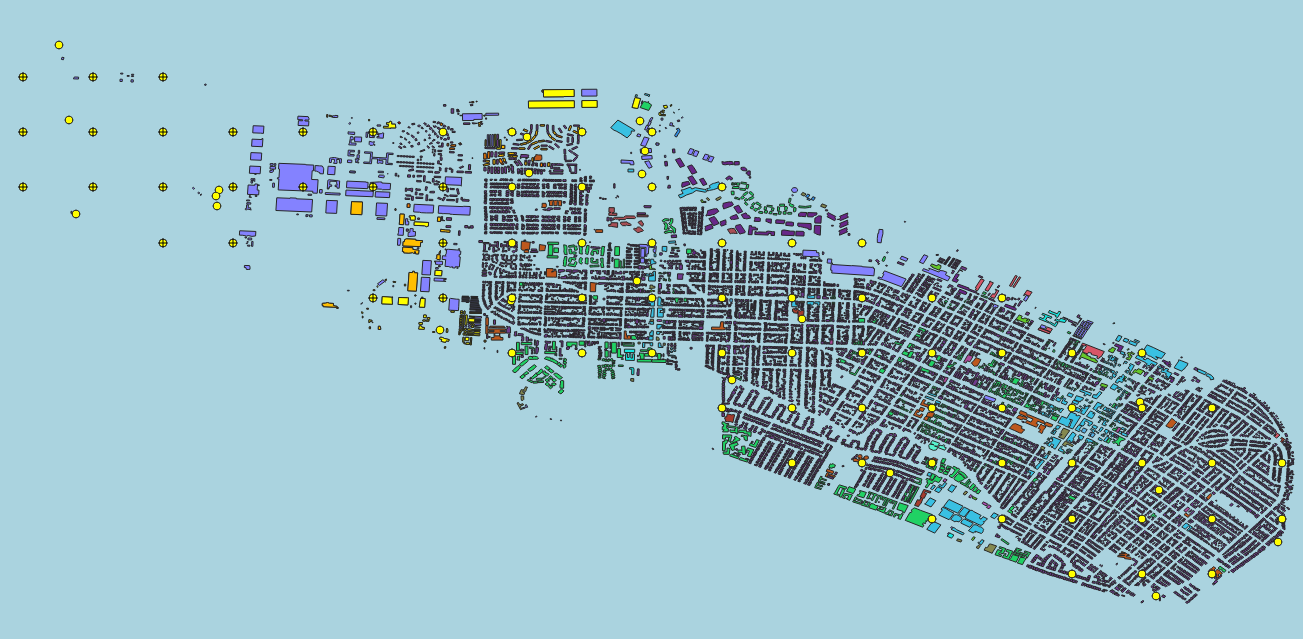
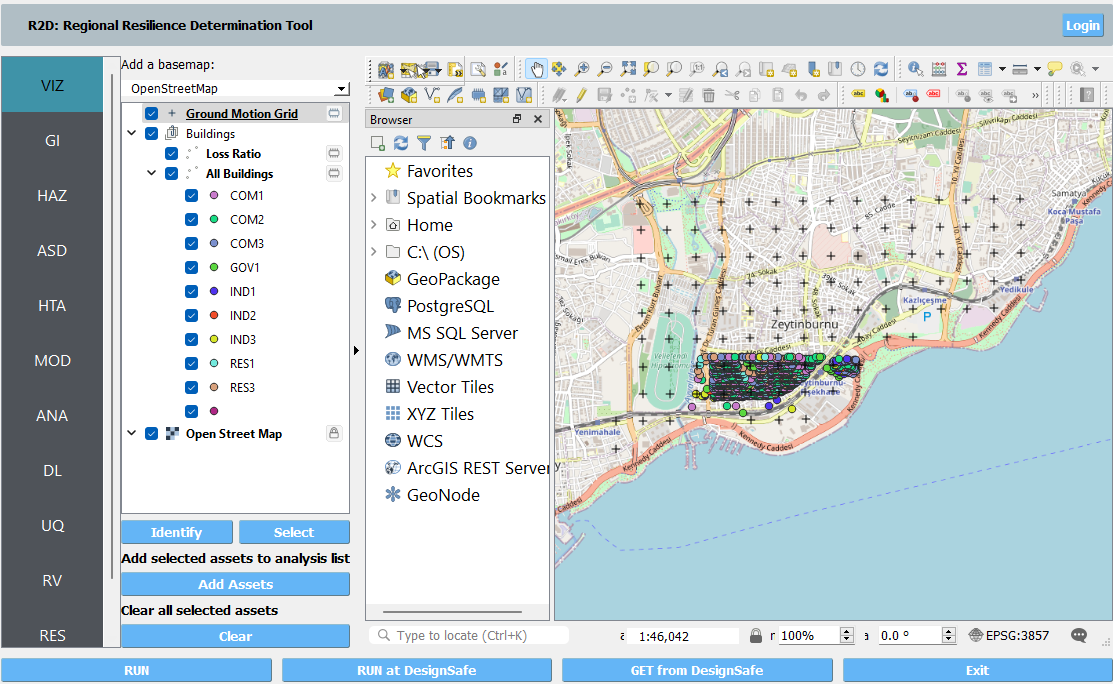
This example features a systematic regional seismic damage and loss assessment for Istanbul, Turkey. The ground motion acceleration time histories were simulated using the hercules software and a detailed geophysical model of Istanbul region ([ZhangEtAl2021]_). The ground motions are used to investigate the impact of a Mw7.0 earthquake on the Central Marmara Basin fault. Engineering Demand Parameters are simulated with OpenSees models for individual reinforced concrete buildings in this example. Building damage and loss is evaluated the story-level based on the HAZUS earthquake damage and loss assessment methodology.
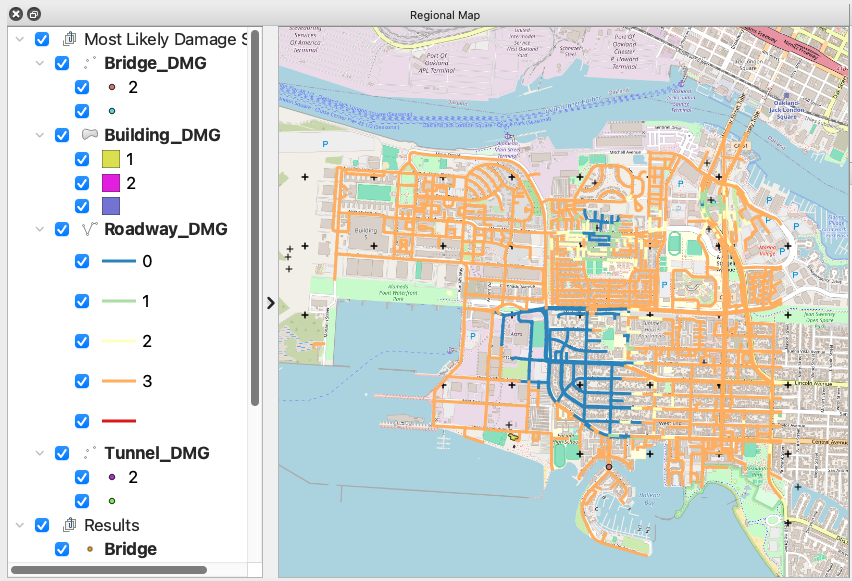
This earthquake example demonstrates rapid analysis capabilities with the HAZUS earthquake damage and loss assessment methodology for transportation infrastructure. Asset-level Damage and Losses (D&L) are calculated directly from Intensity Measures (IM) for buildings, highway bridges, highway tunnels and roadways. The IM field that represents ground shaking intensity measures in the Alameda Island, CA, from an Mw7.05 event on the Hayward fault, was obtained from Probabilistic Seismic Hazard Analysis (PSHA). The liquefaction induced ground failure intensity measures (Permanent Ground Deformation) are calculated following the method proposed in Wang, C., Wang, D., & Chen, Q. (2021). Regional Evaluation of Liquefaction-Induced Lateral Ground Deformation for City-Scale Transportation Resilience Analysis. Journal of Infrastructure Systems, 27(2), 04021008.
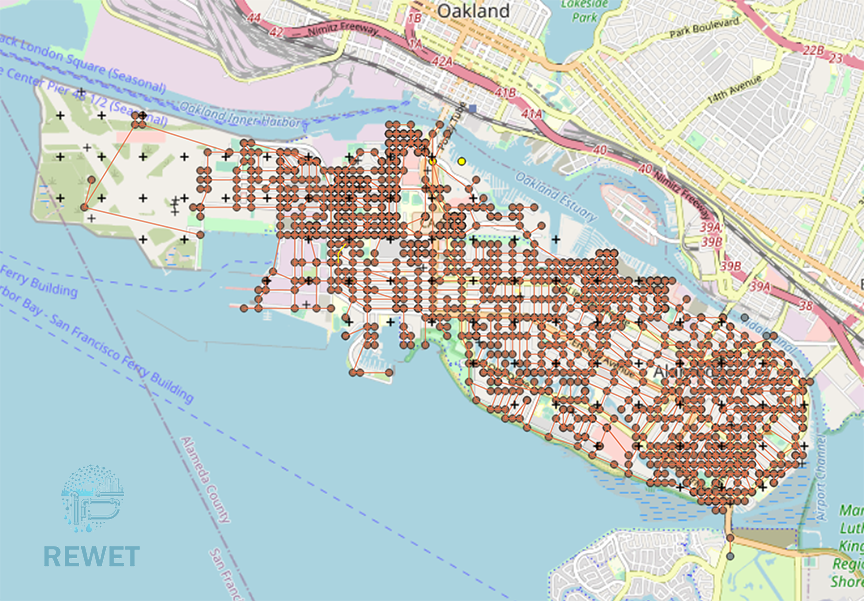
This example demonstrates the water distribution system performance assessment using REWET. REWET is a tool to assess the functionality of a Water Distribution System after any catastrophic event causing damage to the system. RWEET use a general restoration policy. The method is explained in Naeimi Dafchahi, S., & Davidson, R. A. (2023). Post-event restoration simulation of water distribution systems: a generally applicable approach. ProQuest Dissertations & Theses.
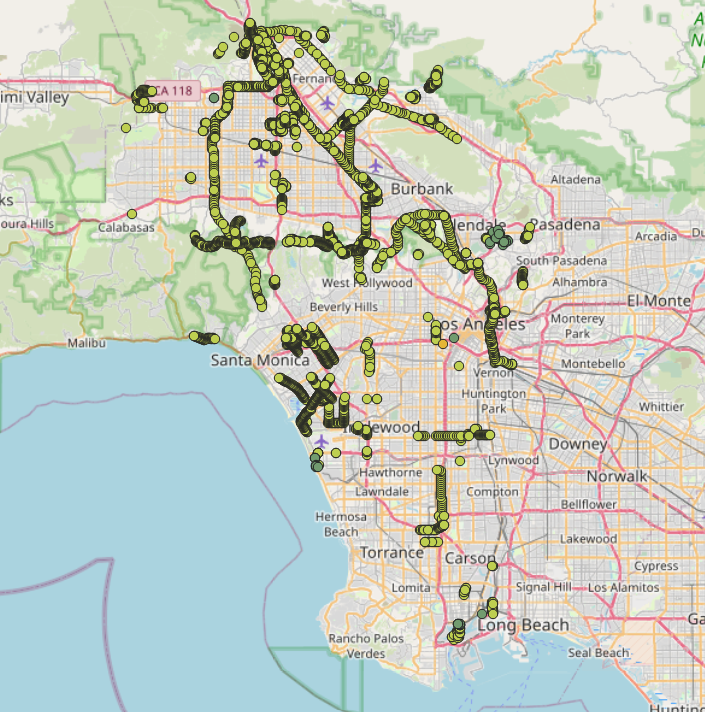
This example demonstrates the damage assessment of electrical power network due to ground shaking and failure caused by earthquake using the HAZUS methodology. To achieve this, we use LA power network data that are already provided from BRAILS. The event data is generated using the Regional Earthquake Event Generation tool. The damage assessment is performed using the PELICUN damage model - inline with HAZUS methodology.
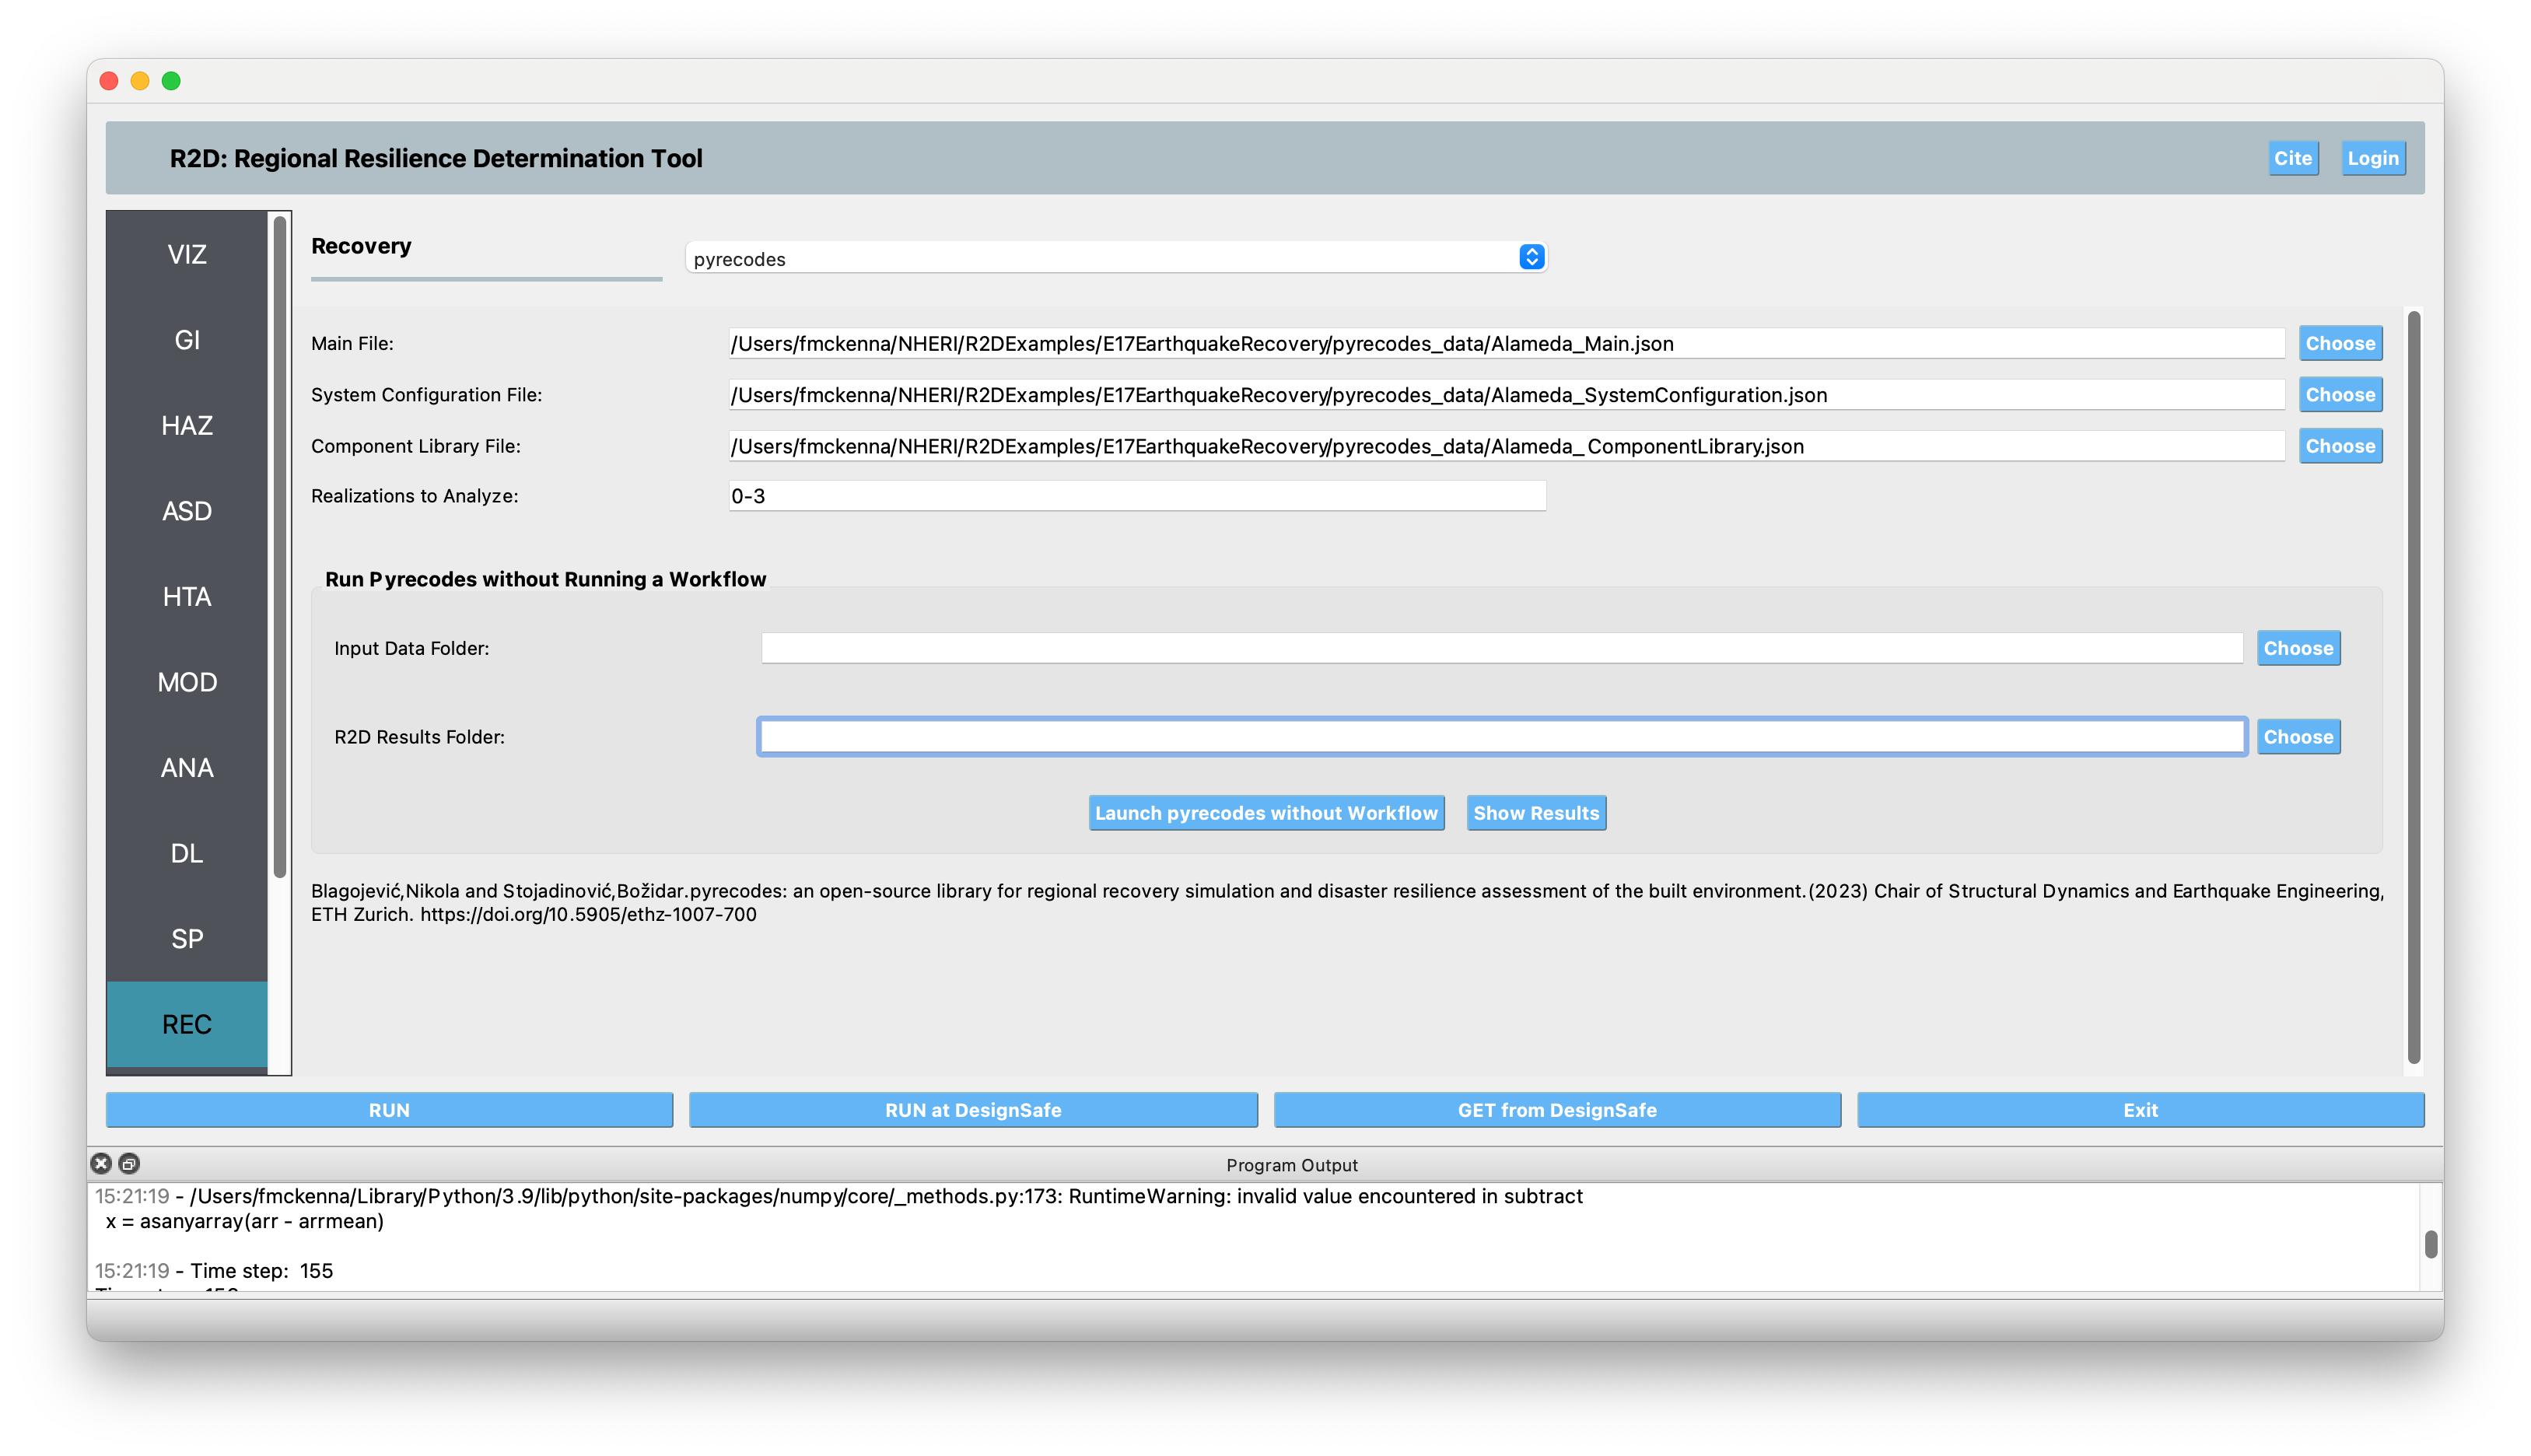
This earthquake example demonstrates the ability to simulate recover post damage determination. The example demonstrates utilizng **pyrecoes** in the workflow to model the recovery post event.
