4.4. E4 - OpenSeesPy FEM
Download files |
Advanced response estimation is enabled in this example through custom scripts that generate a finite element model for a building using the information available in the building inventory. A template script is provided that creates a building-specific cantilever and performs the response-history analysis to obtain EDPs. The hazard is described by empirical ground motion records from the PEER NGA West2 database. The buildings are located in Albany, CA, and their damage and loss assessment is based on the HAZUS methodology. This example includes 81 buildings and 5 are selected for analysis.
4.4.1. Required Files
cantilever_light.py This Python script defines the following functions which use OpenSeesPy to construct a structural model.
4.4.2. Modeling Procedure
This example is a small-scale regional earthquake risk assessment which performs response simulation and damage/loss estimation for a group of 20 wood buildings under a pseudo earthquake scenario. The procedure for this example can be configured through the R2D interface by sequentially entering the following parameters into the respective panels:
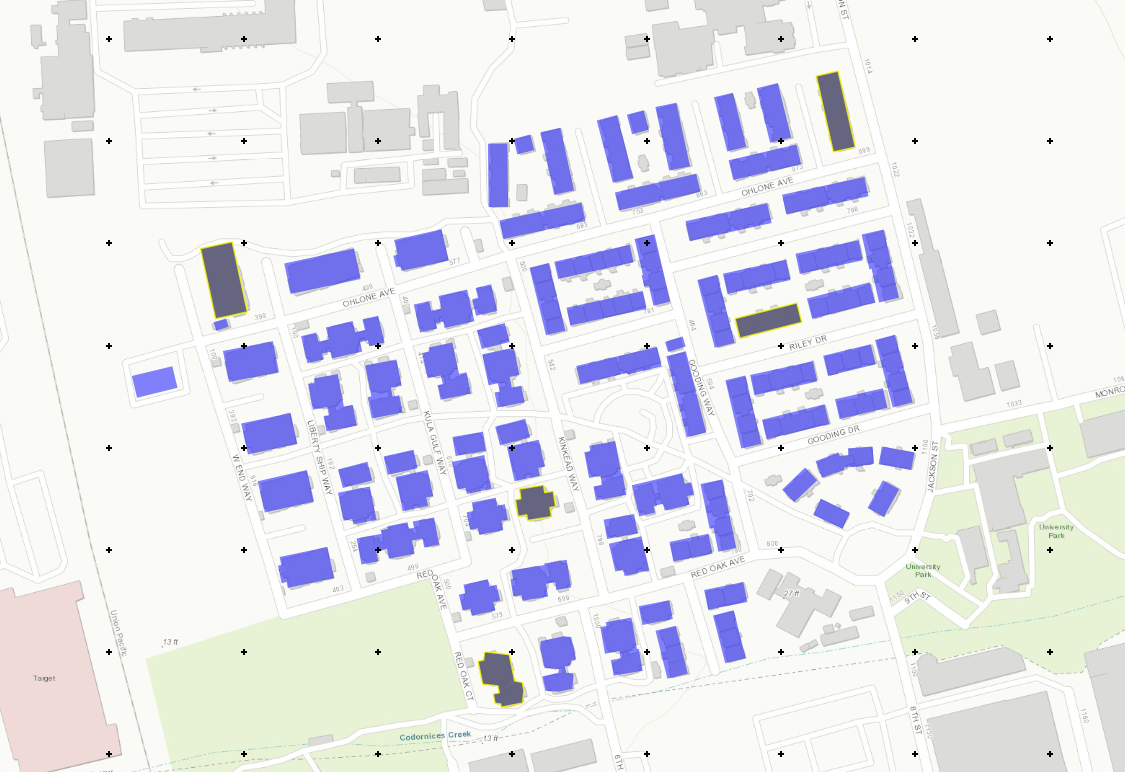
VIZ The visualization pane shows the assets and ground motion grid.

GI Next, the general information panel is used to broadly characterize the problem at hand. In this example, the imperial force and length units are used, and we’re interested in the building engineering demand parameters (e.g., peak story drift ratio, peak floor acceleration), damage measures, and the resulting decision variable (e.g., expected replacement cost).

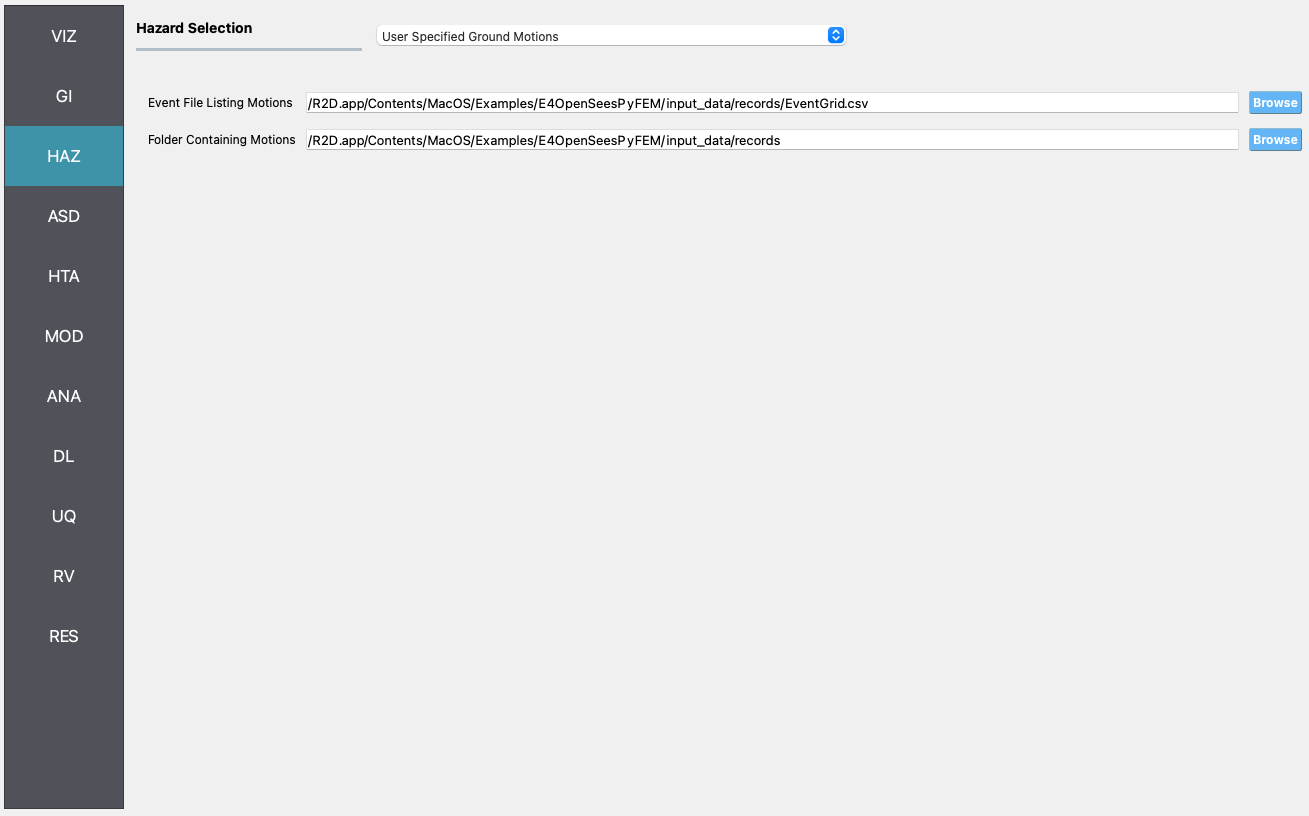
HAZ Now in the hazard panel, the User Specified Ground Motions option is selected which allows for the use of pre-generated earthquake scenarios. The following figure shows the relevant example files which are now entered in this pane. These ground motion records are selected for stations in a grid.
ASD In the asset definition panel, the path to the
input_params.csvfile is specified. Once this file is loaded, the user can select which particular assets will be included in the analysis by entering a valid range in the form and clicking Select. Theinput_params.csvincludes parameters for the damage and loss assessment (i.e., number of stories, year of built, occupancy class, structure type, plan area, and replacement cost) are specified.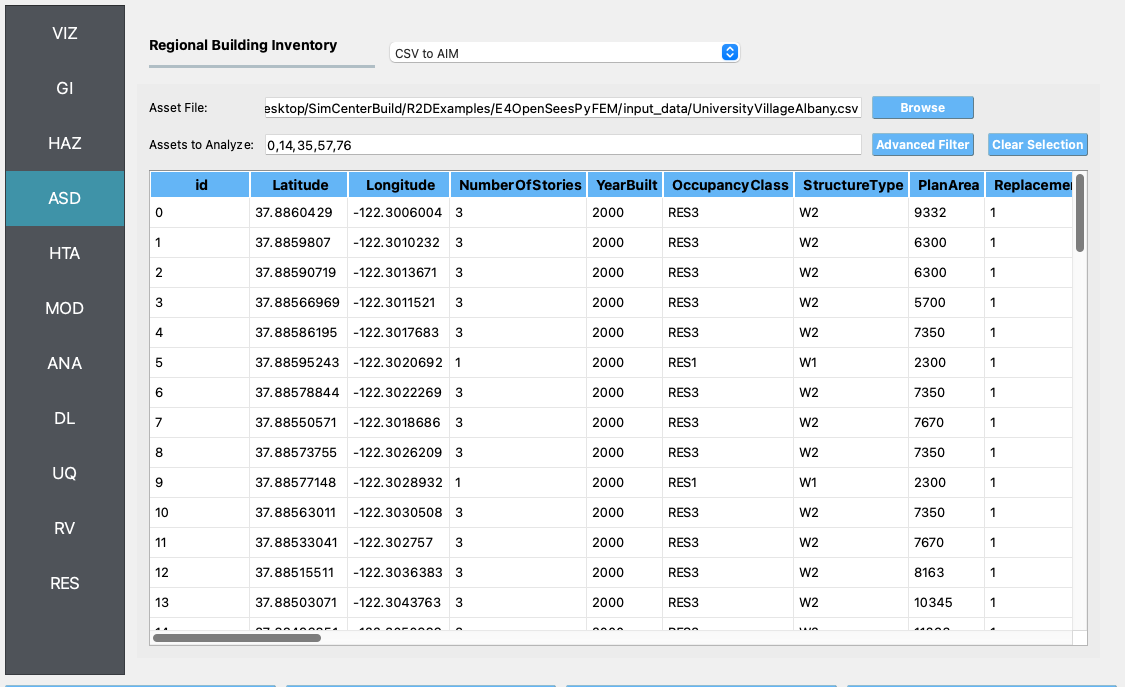
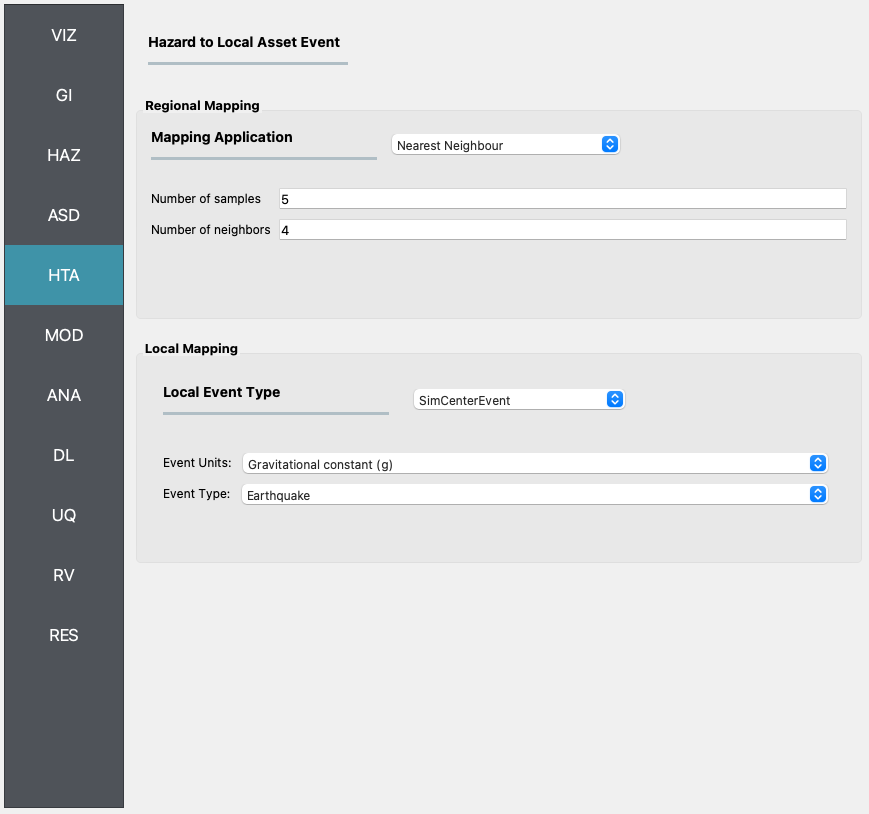
HTA Next, a hazard mapping algorithm is specified using the Nearest Neighbor method and the SimCenterEvent application, which are configured as shown in the following figure with 5 samples in 4 neighbors, i.e., randomly sampling 5 ground motions from the nearest four stations (each station has a set of records specified in the HAZ).
MOD In the modeling panel, the
cantilever_light.pyfile is specified in the Input Script field and a DOF scheme is defined as shown in the following figure. This example uses the OpenSeesPyInput modeling application. The buildings are modeled as elastic-perfectly plastic single-degree-of-freedom (SDOF) systems defined by three input model parameters: the weight, yield strength, and fundamental period.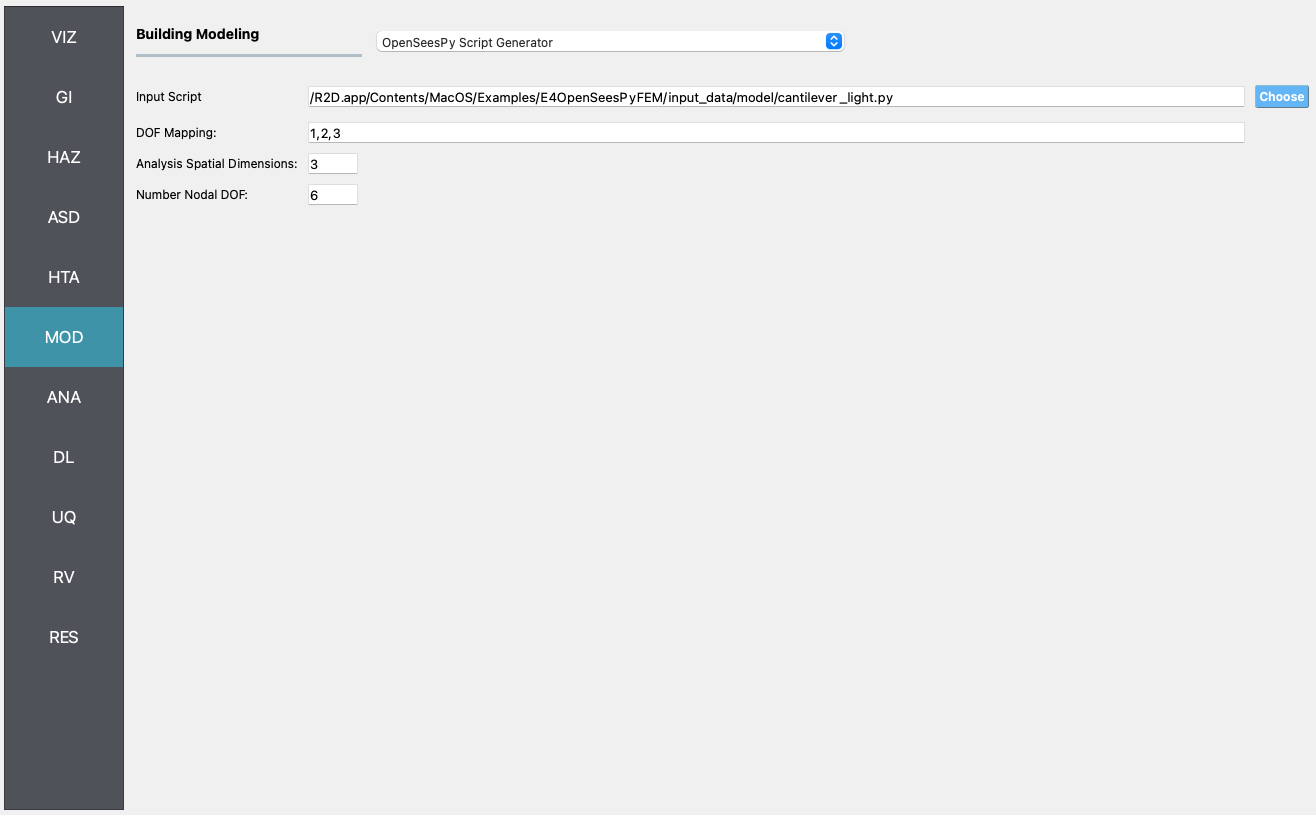
ANA In the analysis panel, OpenSeesPy is selected from the primary dropdown.

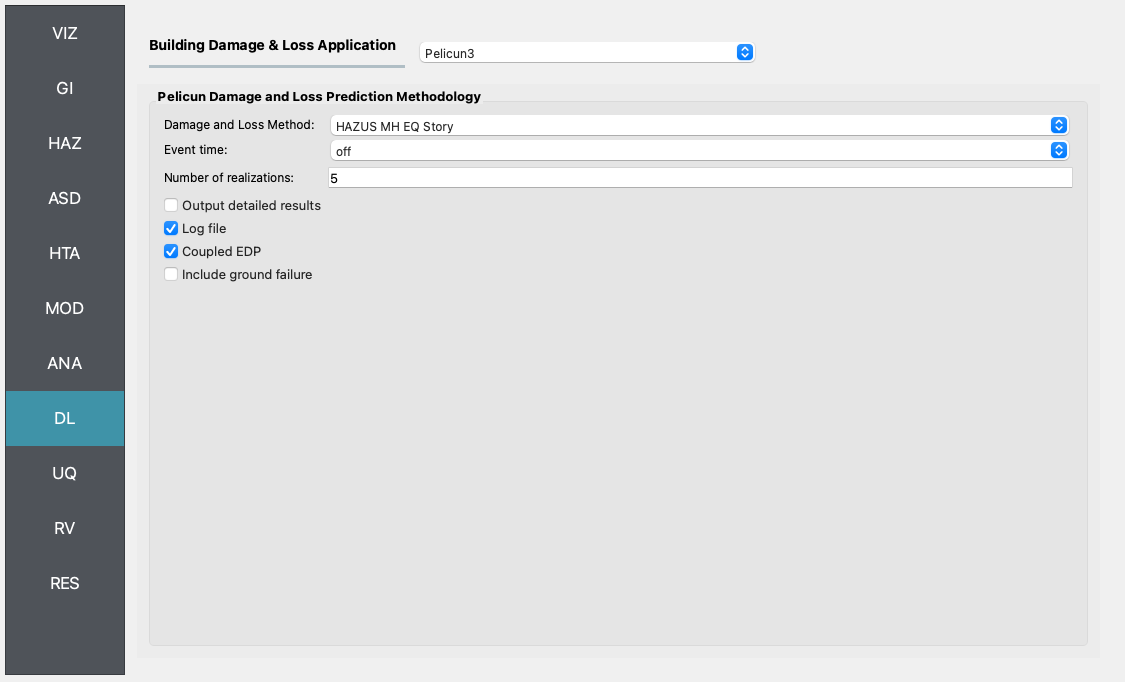
DL The damage and loss panel is now used to configure the Pelicun3 backend. The HAZUS MH EQ Story damage and loss method is selected and configured as shown in the following figure:
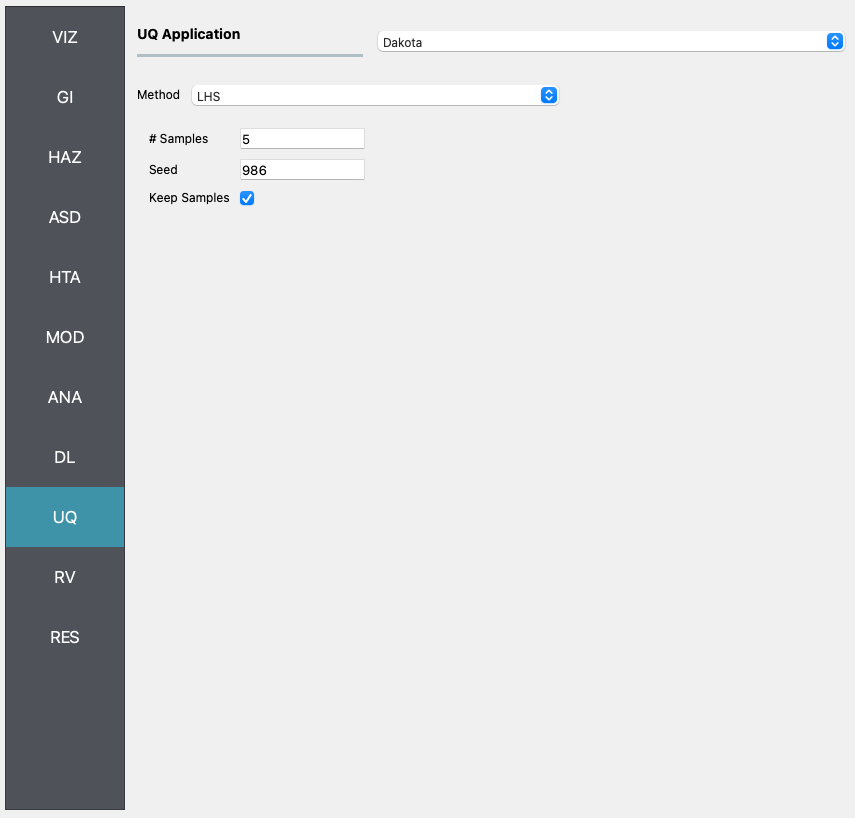
UQ In the UQ panel Dakota uncertainty quantification engine is employed to carry out Latin Hypercube Sampling (LHS) with 5 samples and an arbitrary seed for reproducibility.
RV
The random variable panel will be left empty for this example.
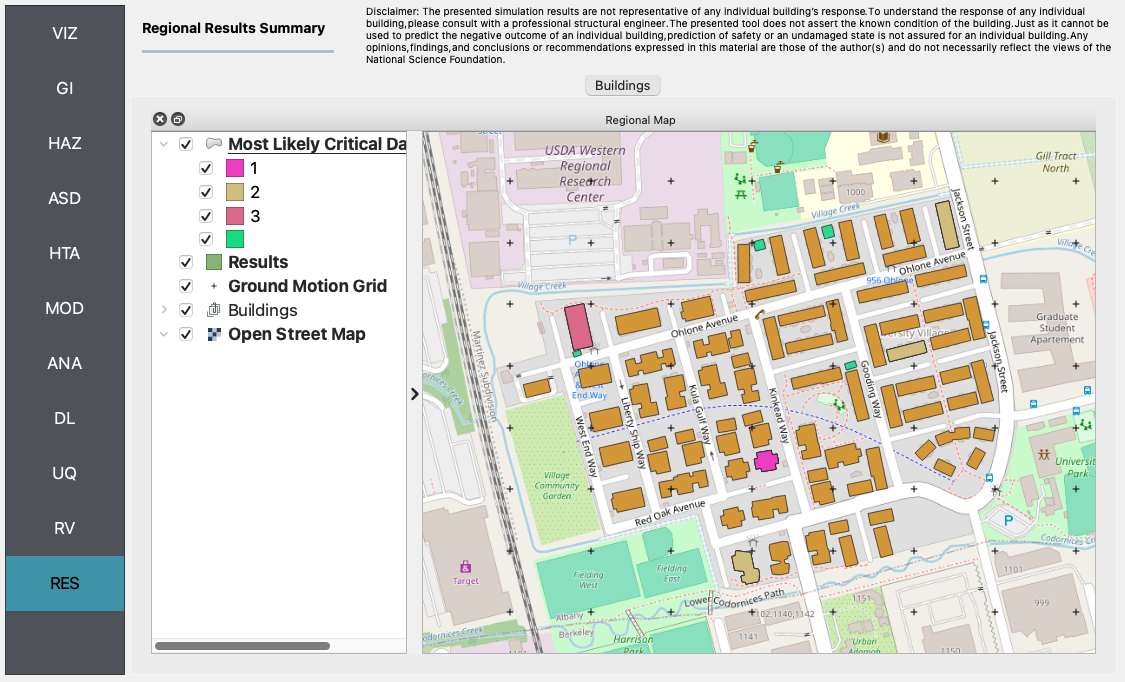
RES The analysis outputs for the selected buildings are shown in the figure below.
