4.2. E2 - MDOF Building Response
Download files |
This example uses ground motions from the 2018 earthquake in Anchorage, AK, to characterize the response of buildings with an idealized MDOF building model through story-level Engineering Demand Parameters (EDP). Exploiting the refinement in EDPs, a HAZUS-based story-level assessment is employed to evaluate the performance of 5 buildings. The results presented herein are only for demonstrating the use of R2DTool and do not serve as an accurate representation of the real losses resulting from the earthquake.
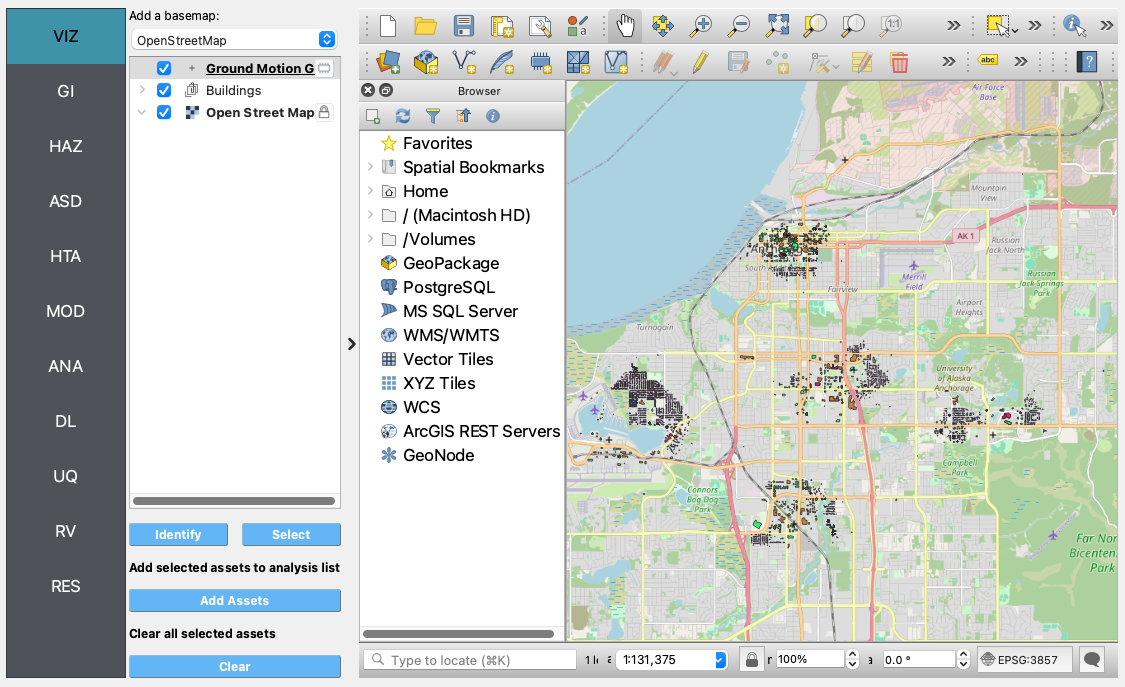
VIZ The visualization pane highlighting the assets available in this example.
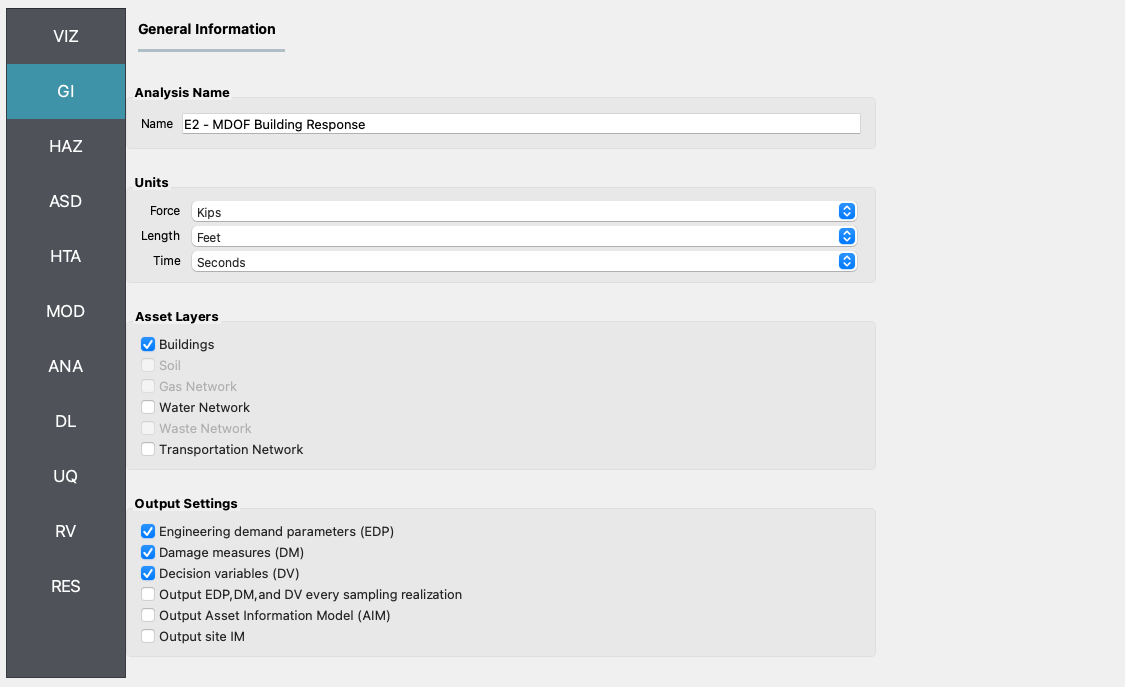
GI First, the unit system and asset type are prescribed in this panel, and we’re interested in the building engineering demand parameters, damage measures, and the resulting decision variables.
HAZ 12 recorded ground motions across Anchorage (from the Center for Engineering Strong Motion Data, CESMD) are used as the ground acceleration time history inputs in this example. The PGA values of these 12 records range from 0.12 g to 0.81 g.
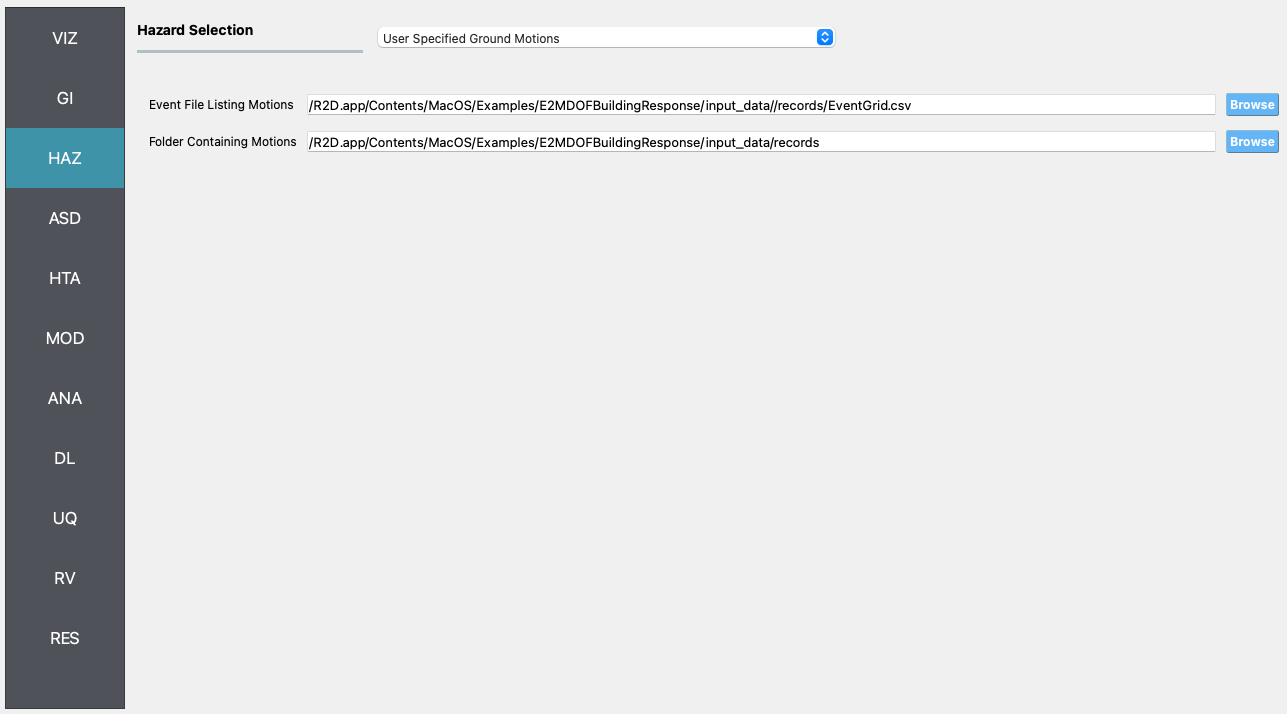
ASD In the asset definition panel, the path to the
AnchorageBuilding.csvfile is specified. Once this file is loaded, the user can select which particular assets will be included in the analysis by entering a valid range (e.g., 1-50) in the form and clicking Select. TheAnchorageBuilding.csvincludes parameters for the damage and loss assessment (i.e., number of stories, year of built, occupancy class, structure type, and plan area) for more than 80,000 buildings in the community.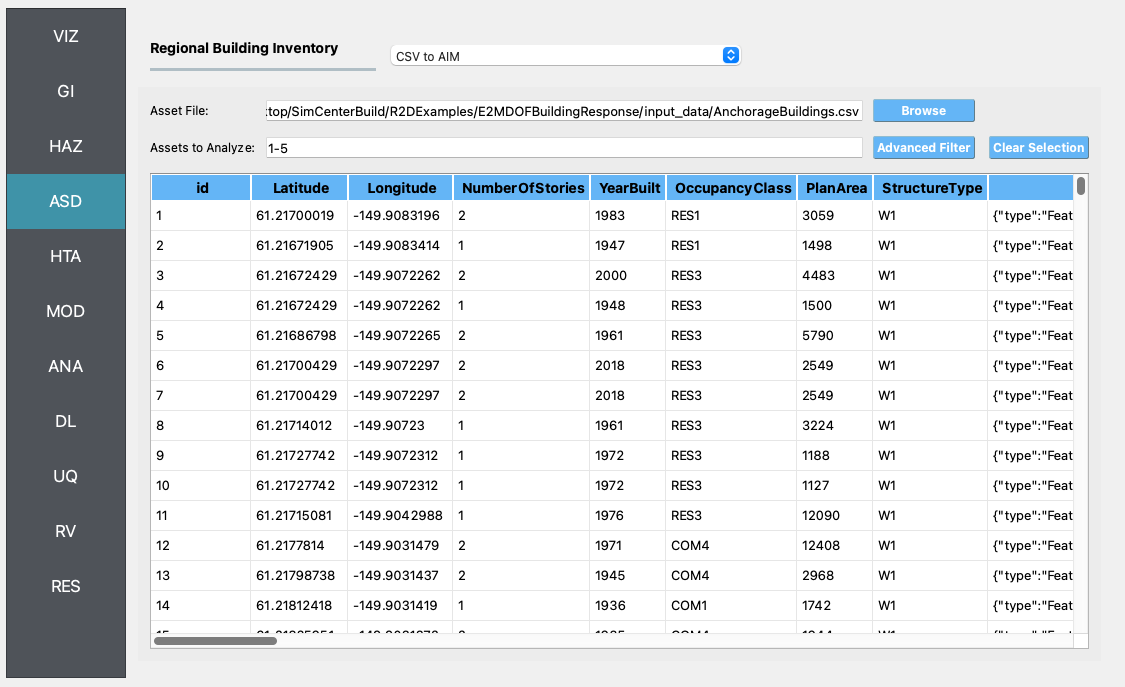
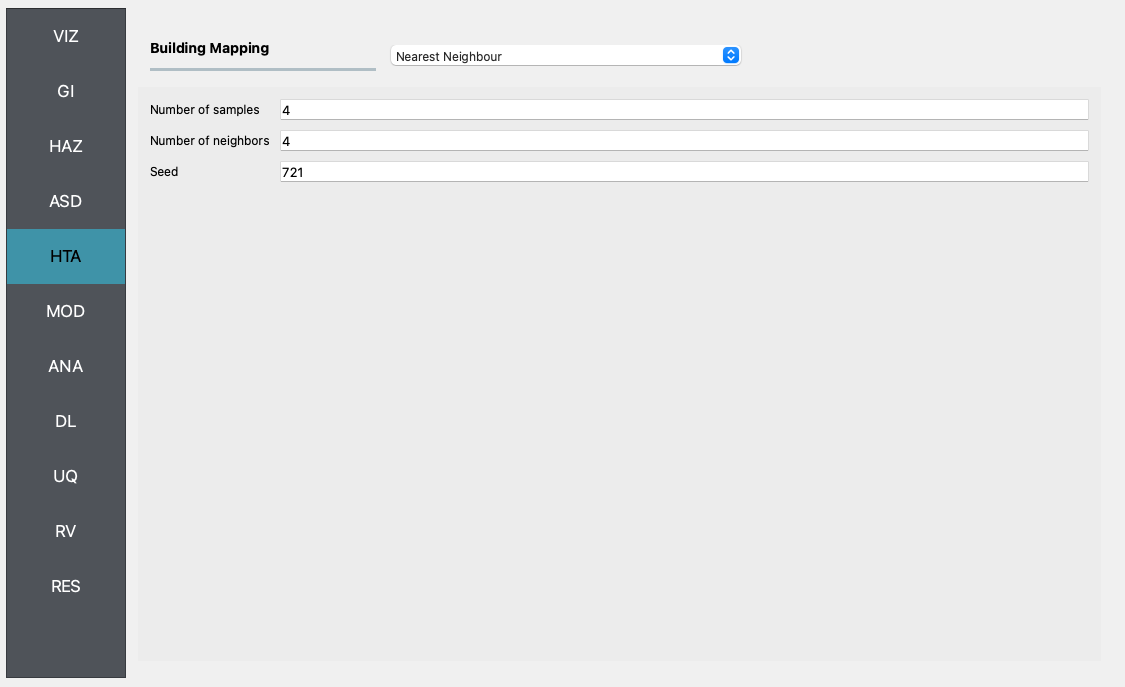
HTA Next, a hazard mapping algorithm is specified using the Nearest Neighbor method and the SimCenterEvent application, which are configured as shown in the following figure with 4 samples in 4 neighbors, i.e., randomly sampling 4 ground motions from the nearest four stations (each station has one ground motion recording specified in the HAZ).
MOD In the modeling panel, the MDOF-LU method is used to create Multi-Degree-Of-Freedom (MDOF) nonlinear shear building model from the input
AnchorageBuilding.csv. Following the HAZUS EQ Technical Manual Chapter 5, a hysteretic nonlinear material is defined for each story with a story shear and displacement relationship with the initial stiffness, over-strength ratio, hardening ratio, and degradation factor. These parameters are stored in theHazusData.txtfor different building design levels (e.g., high-, moderate-, or pre-code) which is now primarily based on the built year of the structure.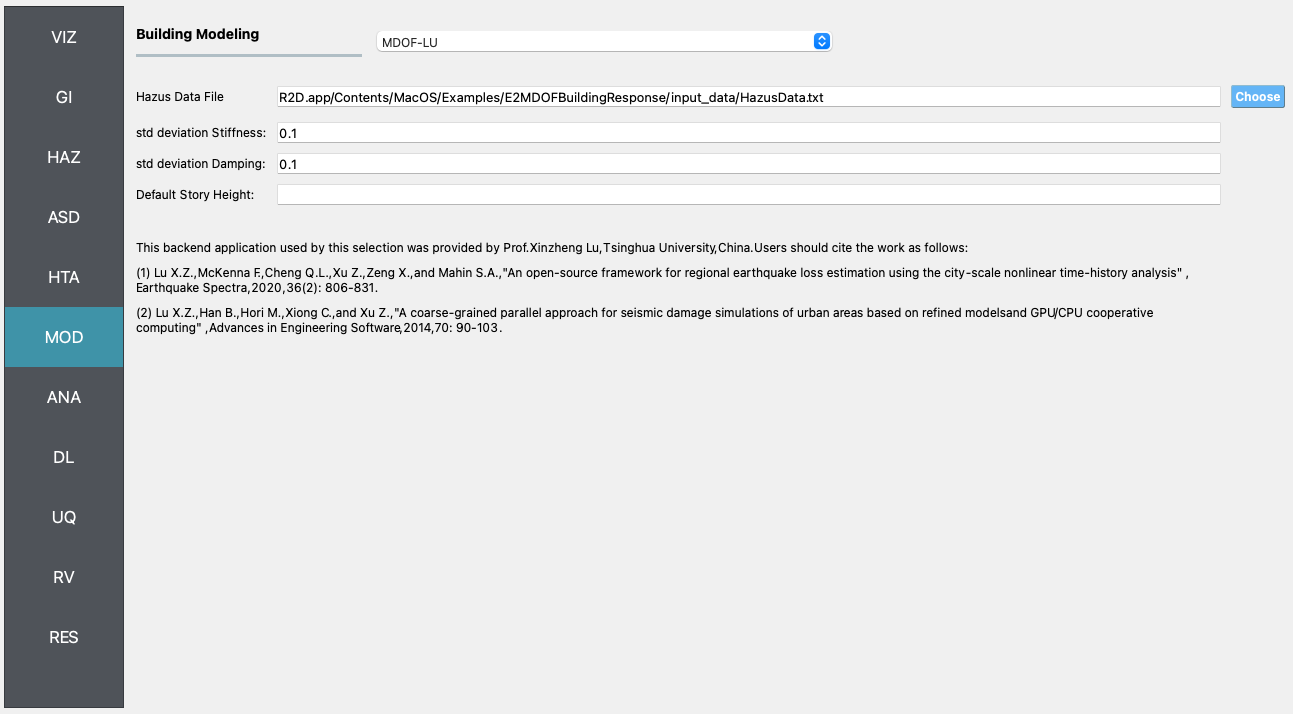
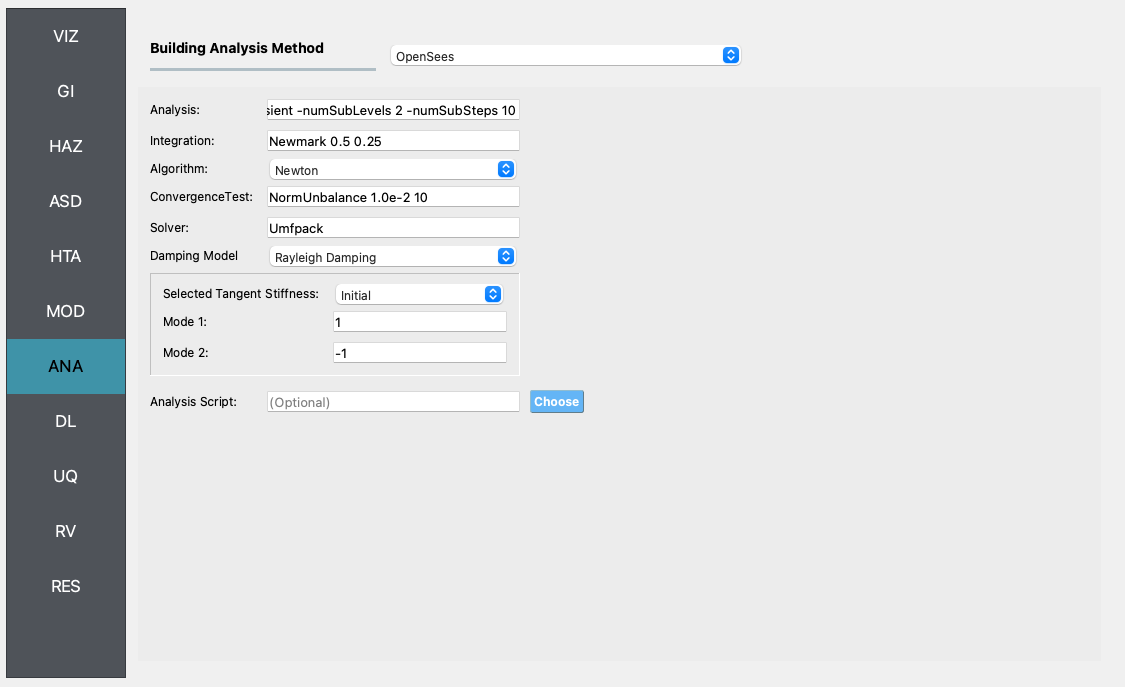
ANA In the analysis panel, OpenSees is selected from the primary dropdown.
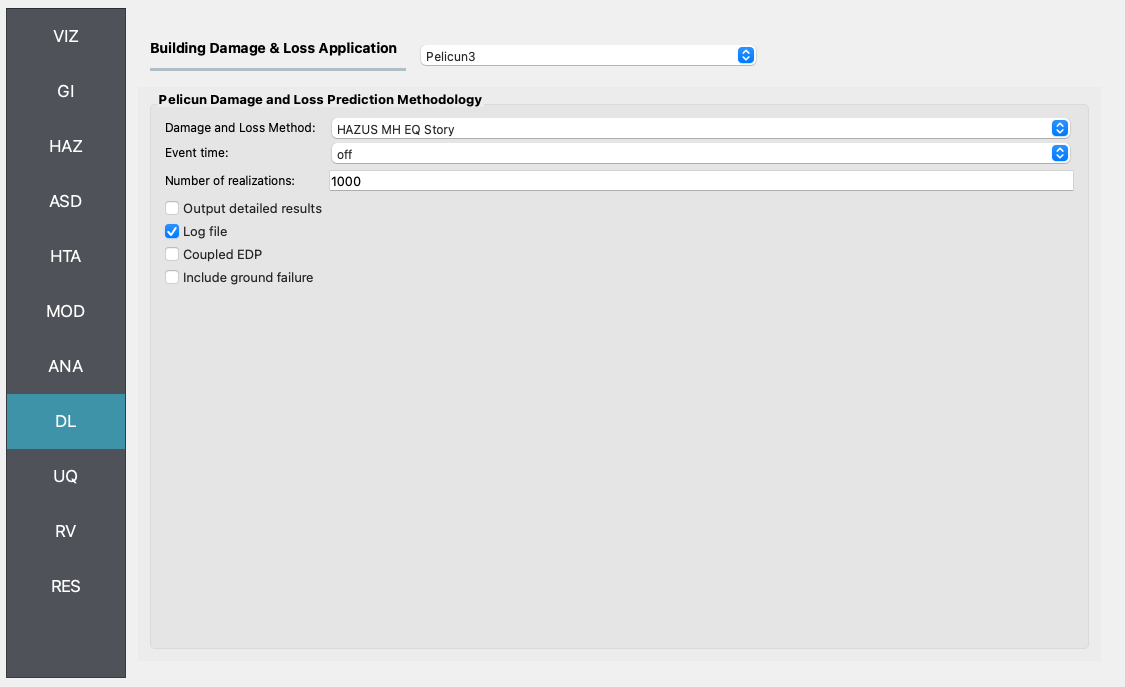
DL The damage and loss panel is now used to configure the Pelicun3 backend. The HAZUS MH EQ Story damage and loss method is selected and configured as shown in the following figure:
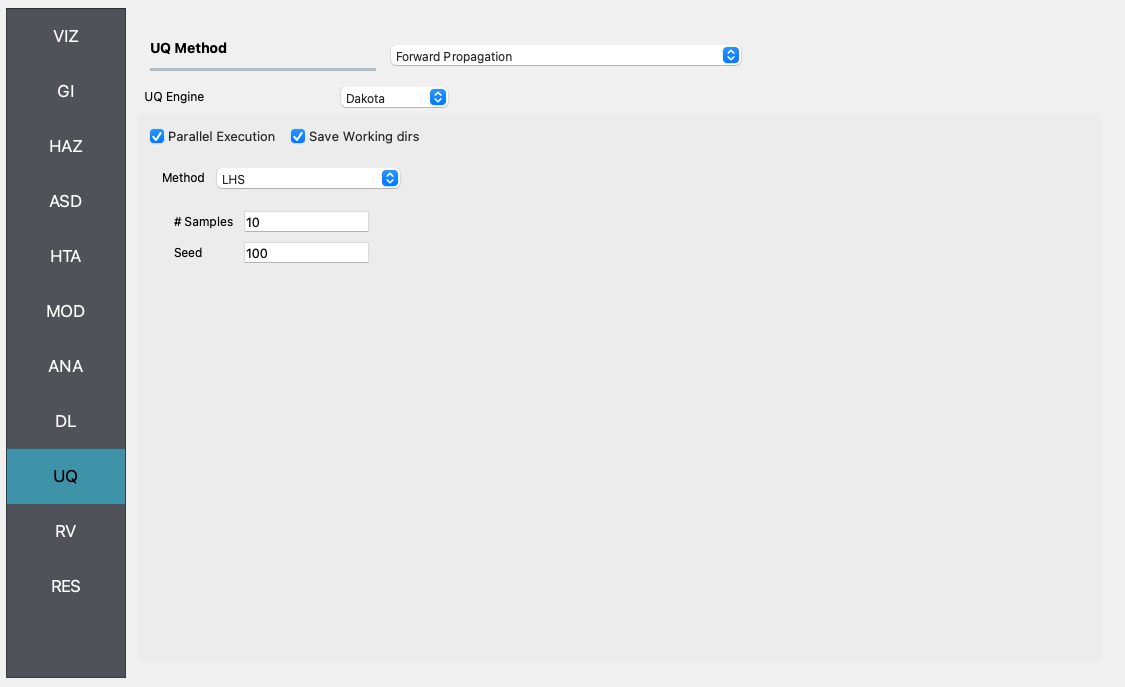
UQ In the UQ panel the Dakota uncertainty quantification engine is employed to carry out Latin Hypercube Sampling (LHS) with 10 samples and an arbitrary seed for reproducibility.
RV
The random variable panel will be left empty for this example.
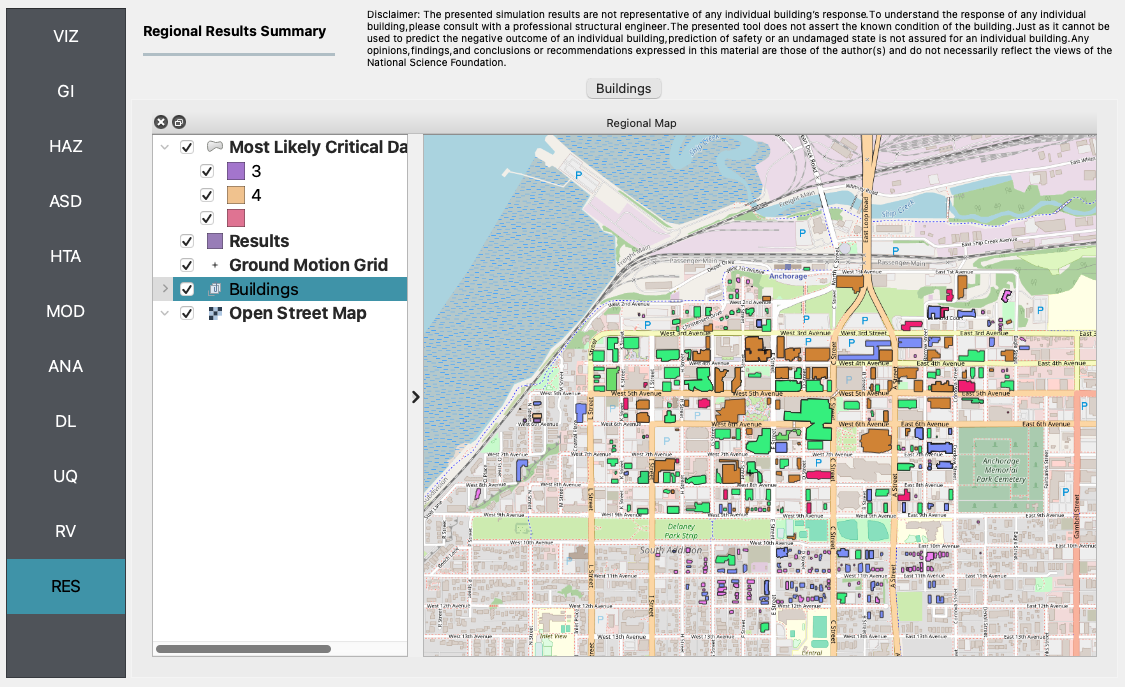
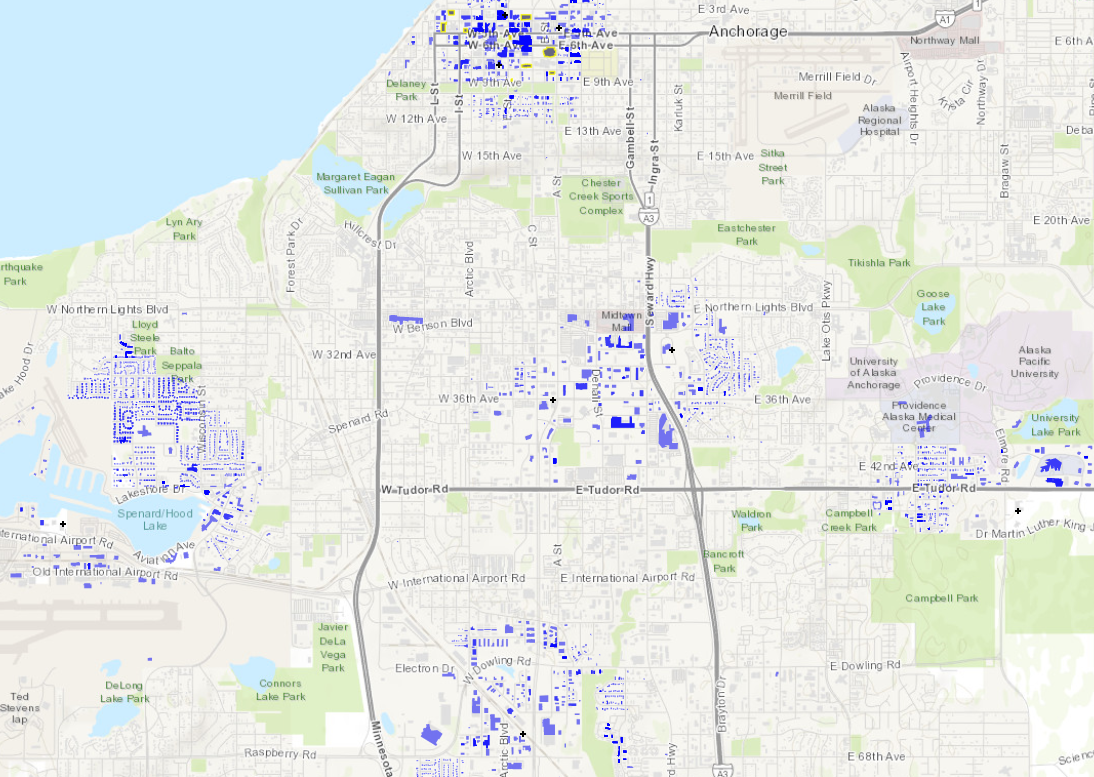
RES The analysis outputs for the selected 50 buildings are shown in the figure below.