4.1. E1 - Basic HAZUS
Download files |
This earthquake example demonstrates rapid analysis capabilities with the HAZUS earthquake damage and loss assessment methodology. Building-level Damage and Losses (D&L) are calculated directly from Intensity Measures (IM) for 25 assets. The IM field that represents peak ground acceleration in the city of San Francisco, CA, from a Mw7.2 event on the San Andreas fault, and was obtained from a Probabilistic Seismic Hazard Analysis (PSHA).
The following 11 items describe the options presented once the example is loaded from the tool menu, or if tif the input.json file is loaded, after it has been downloaded them from the examples github page along with the other files and directories there. These options correspond to the input panels accessible through the ribbon of buttons on the left side of the application.
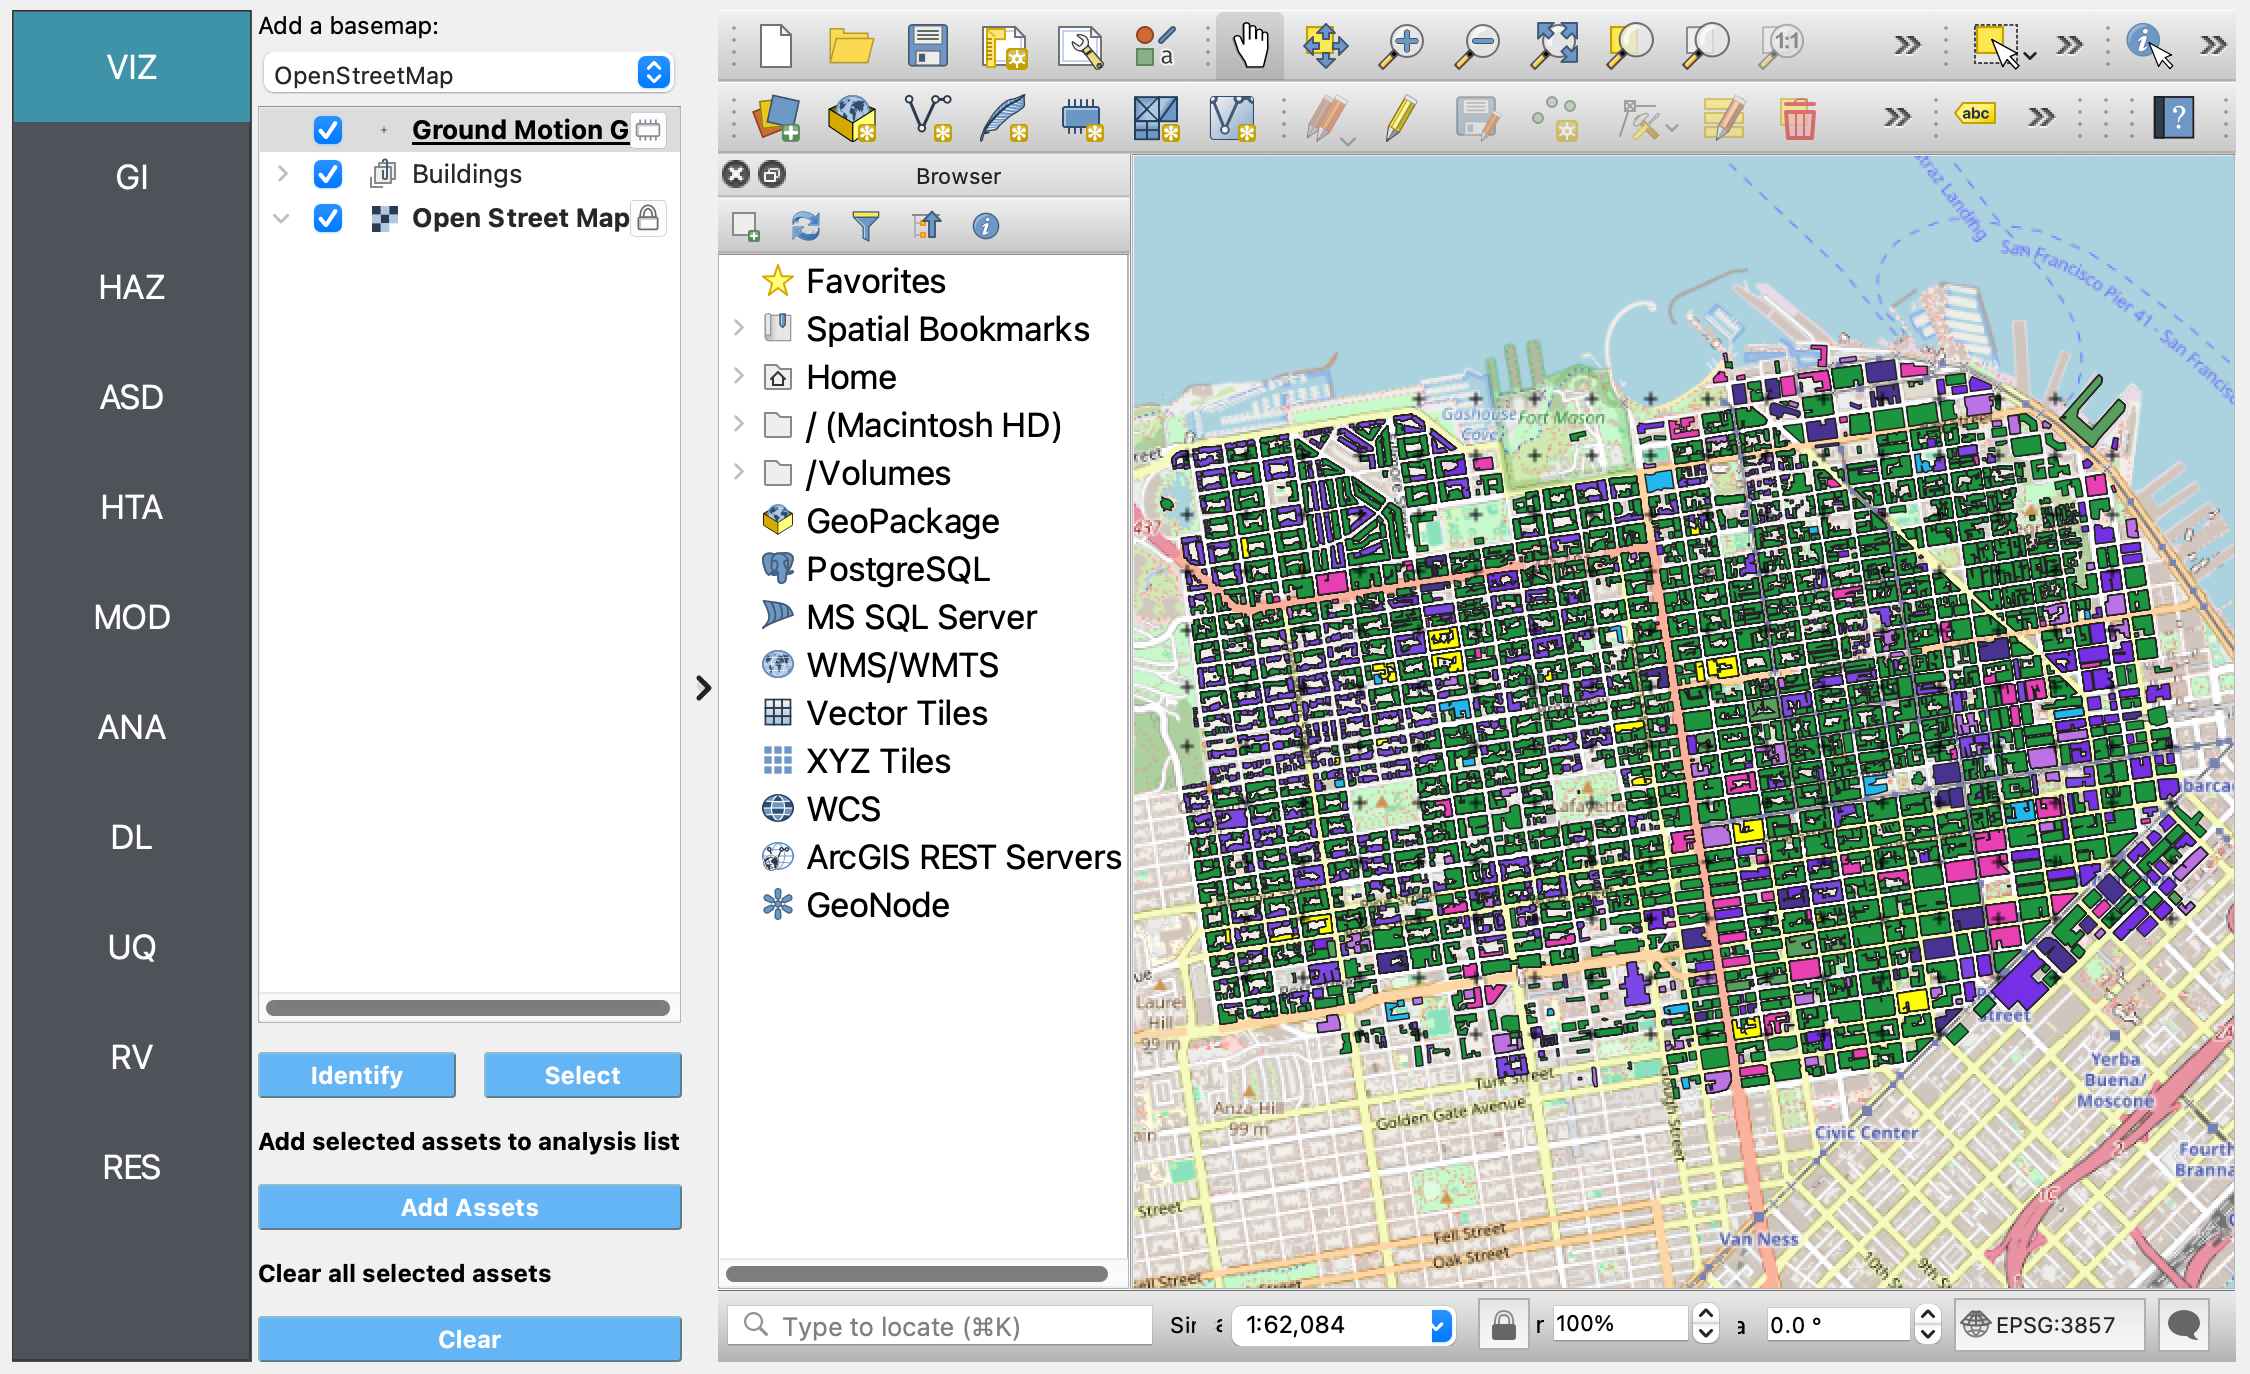
VIZ The visualization panel is in actuality the QGIS application running inside our application. When this example is loaded, QGIS displays three layers: (1) the ground motion grid, (2) the buildings, and (3) the basemap, which defaults to Google Street maps. Users may toggle these layers on or off, switch basemaps, and query objects by selecting the Identify button and clicking on a grid point or building.
Note
Because the QGIS application is running inside R2D, any of the things the user can do with QGIS via the icons at the top of the visualization of the region, they can do inside this R2D window. Using this functionality, will neither break nor alter the workflow defined by the options the user changes when other input panels are selected.
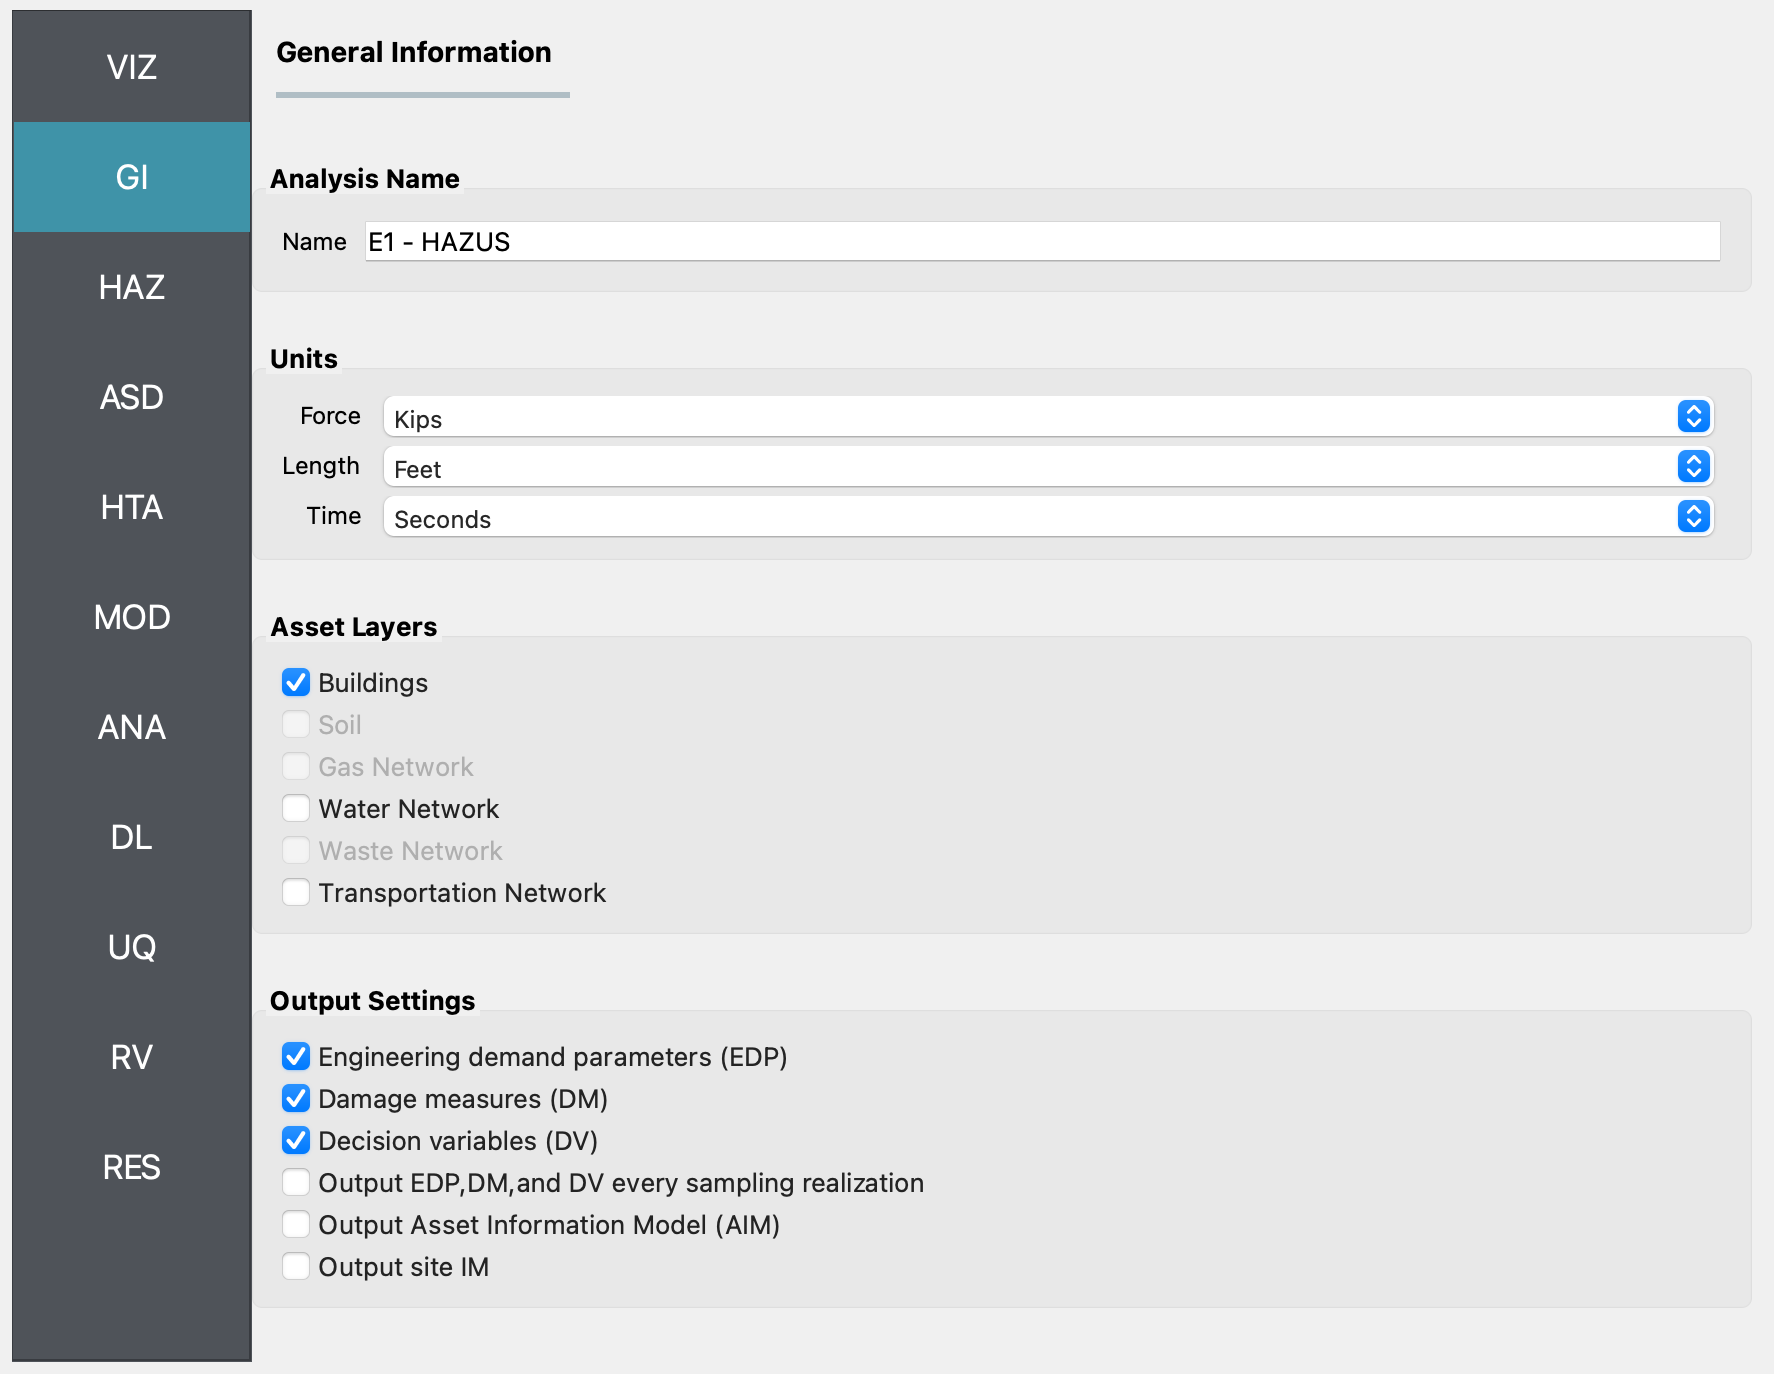
GI The workflow units, asset types and outputs to be studied are prescribed in this panel. The panel as shown in figure below, shows the units are set for the imperial system, that only building assets have been selected as the asset types to be considered in the workflow, and that the user is interested in the engineering demand parameters, damage measures, and the resulting decision variables for the output.
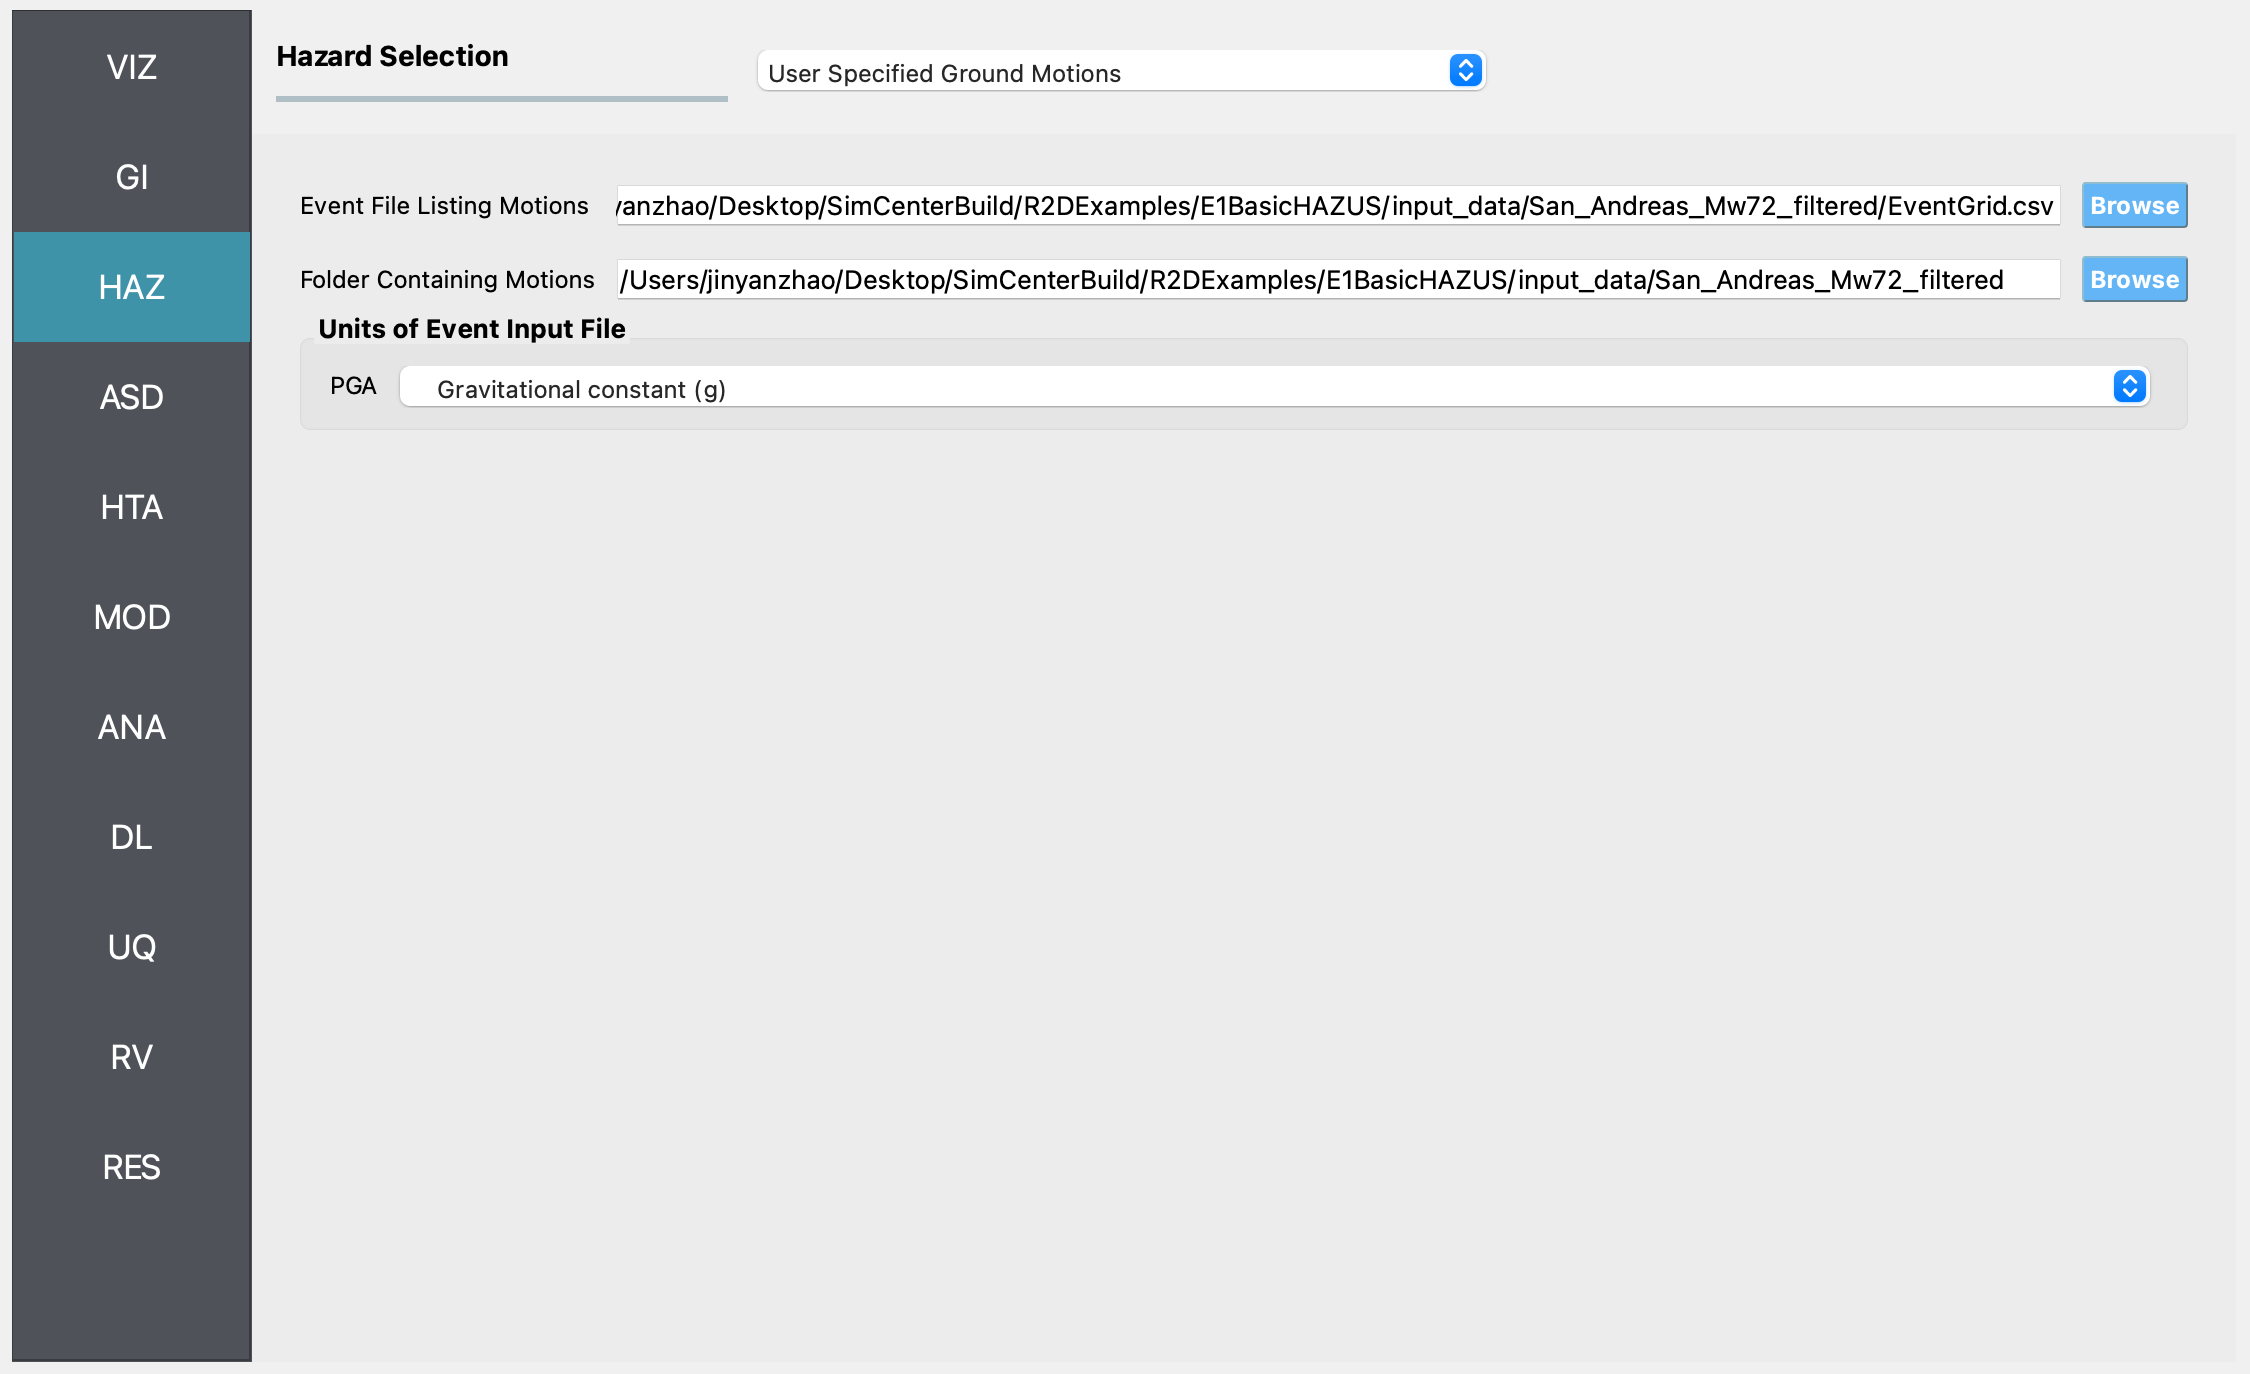
HAZ Next, the hazard panel. For this example, the User Specified Ground Motions option is selected to input the IM field, a series of peak ground accelerations obtained from the PSHA. The input file, :examplesgithub:EventGrid.csv <E1BasicHAZUS/input_data/San_Andreas_Mw72_filtered/EventGrid.csv>, lists filenames, longitudes, and latitudes:
GP_file |
Longitude |
Latitude |
|---|---|---|
Site_1051.csv |
-122.4474 |
37.7935 |
Site_1052.csv |
-122.4474 |
37.7958 |
… |
… |
… |
The corresponding file for each long, lat contains over 1000 PGA values for the corresponding long, lat.
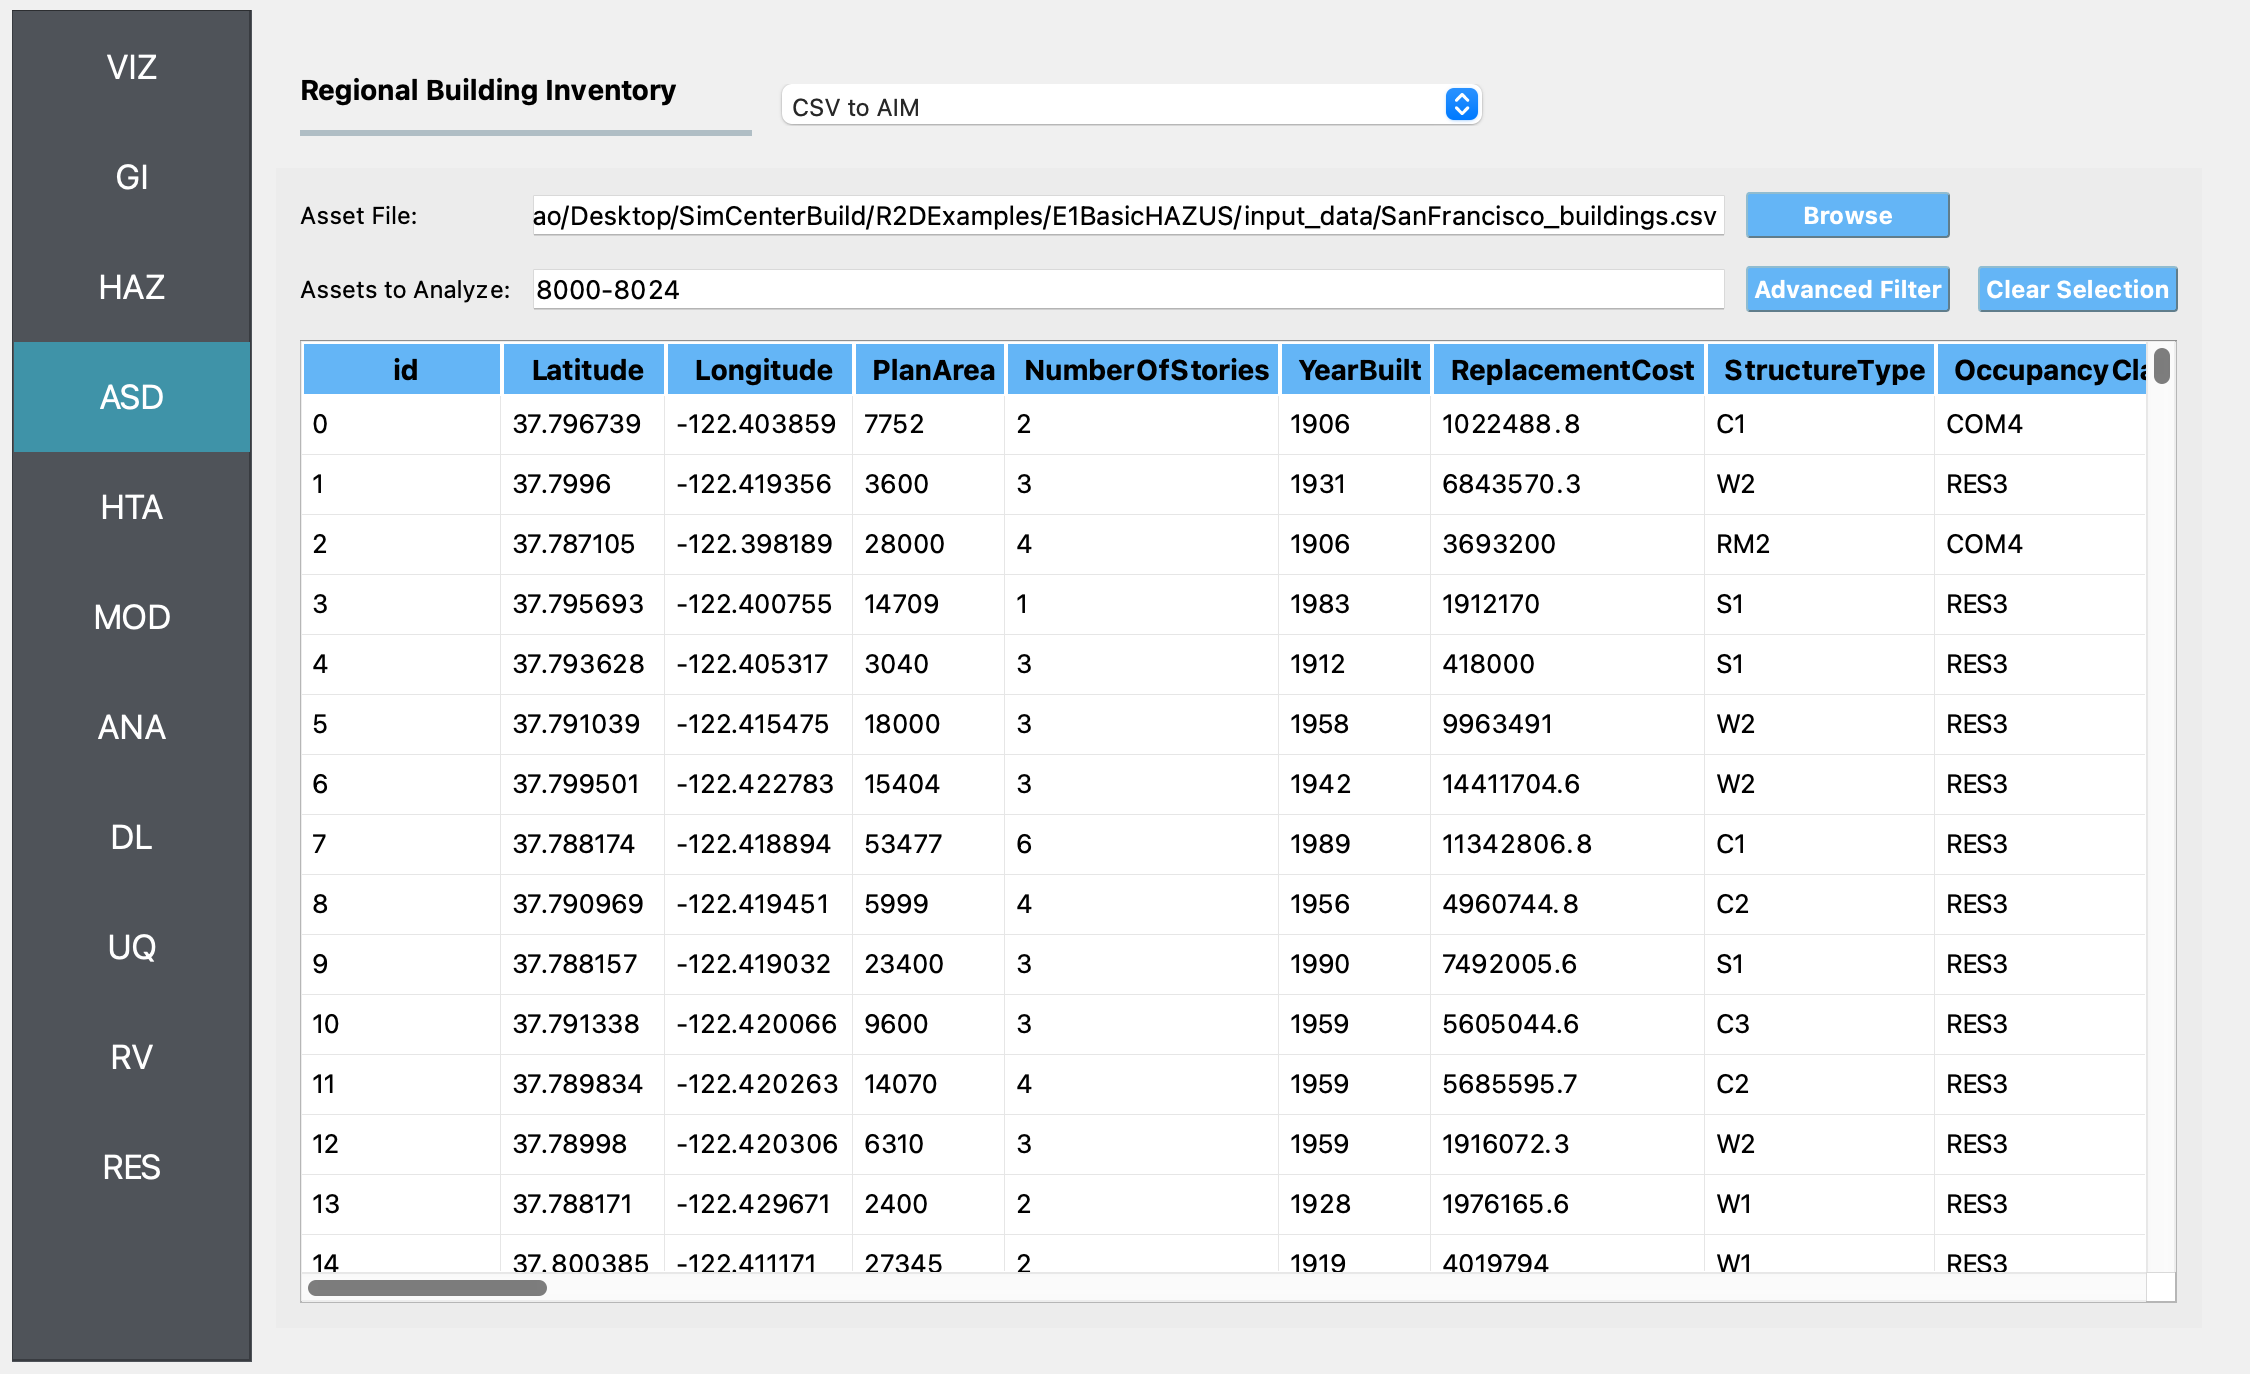
ASD In the asset definition panel, the CVStoAIM option is used to provide information on the assets. Two inputs are required: 1) The path to the csv file, SanFranciscoBuildings.csv, another csv file containing information on all the buildings in the region. The files contains id,Latitude,Longitude,PlanArea,NumberOfStories,YearBuilt,ReplacementCost,StructureType,OccupancyClass,Footprint and 2) the range of assets to be analyzed. In the figure only buildings 8000-8024 have only been selected.
Note
The range of assets uses the id’s of the buildings provided in the asset inventory file.
By defauult NO ASSETS will be analyzed unless the range is filled in.
3. The user can provide a comma seperated list of assets that includes ranges, e.g. 1,2,3,5-10,100-1000. 2. Once the range has been filled in, the user can view the selected buildings by going to the VIZ panel, looking at the buildings layer and selecting the Selected Buildings, and de-selecting All Buildings. 3. If user does not like the selections, the Clear Selections button in the ASD panel can be pressed.
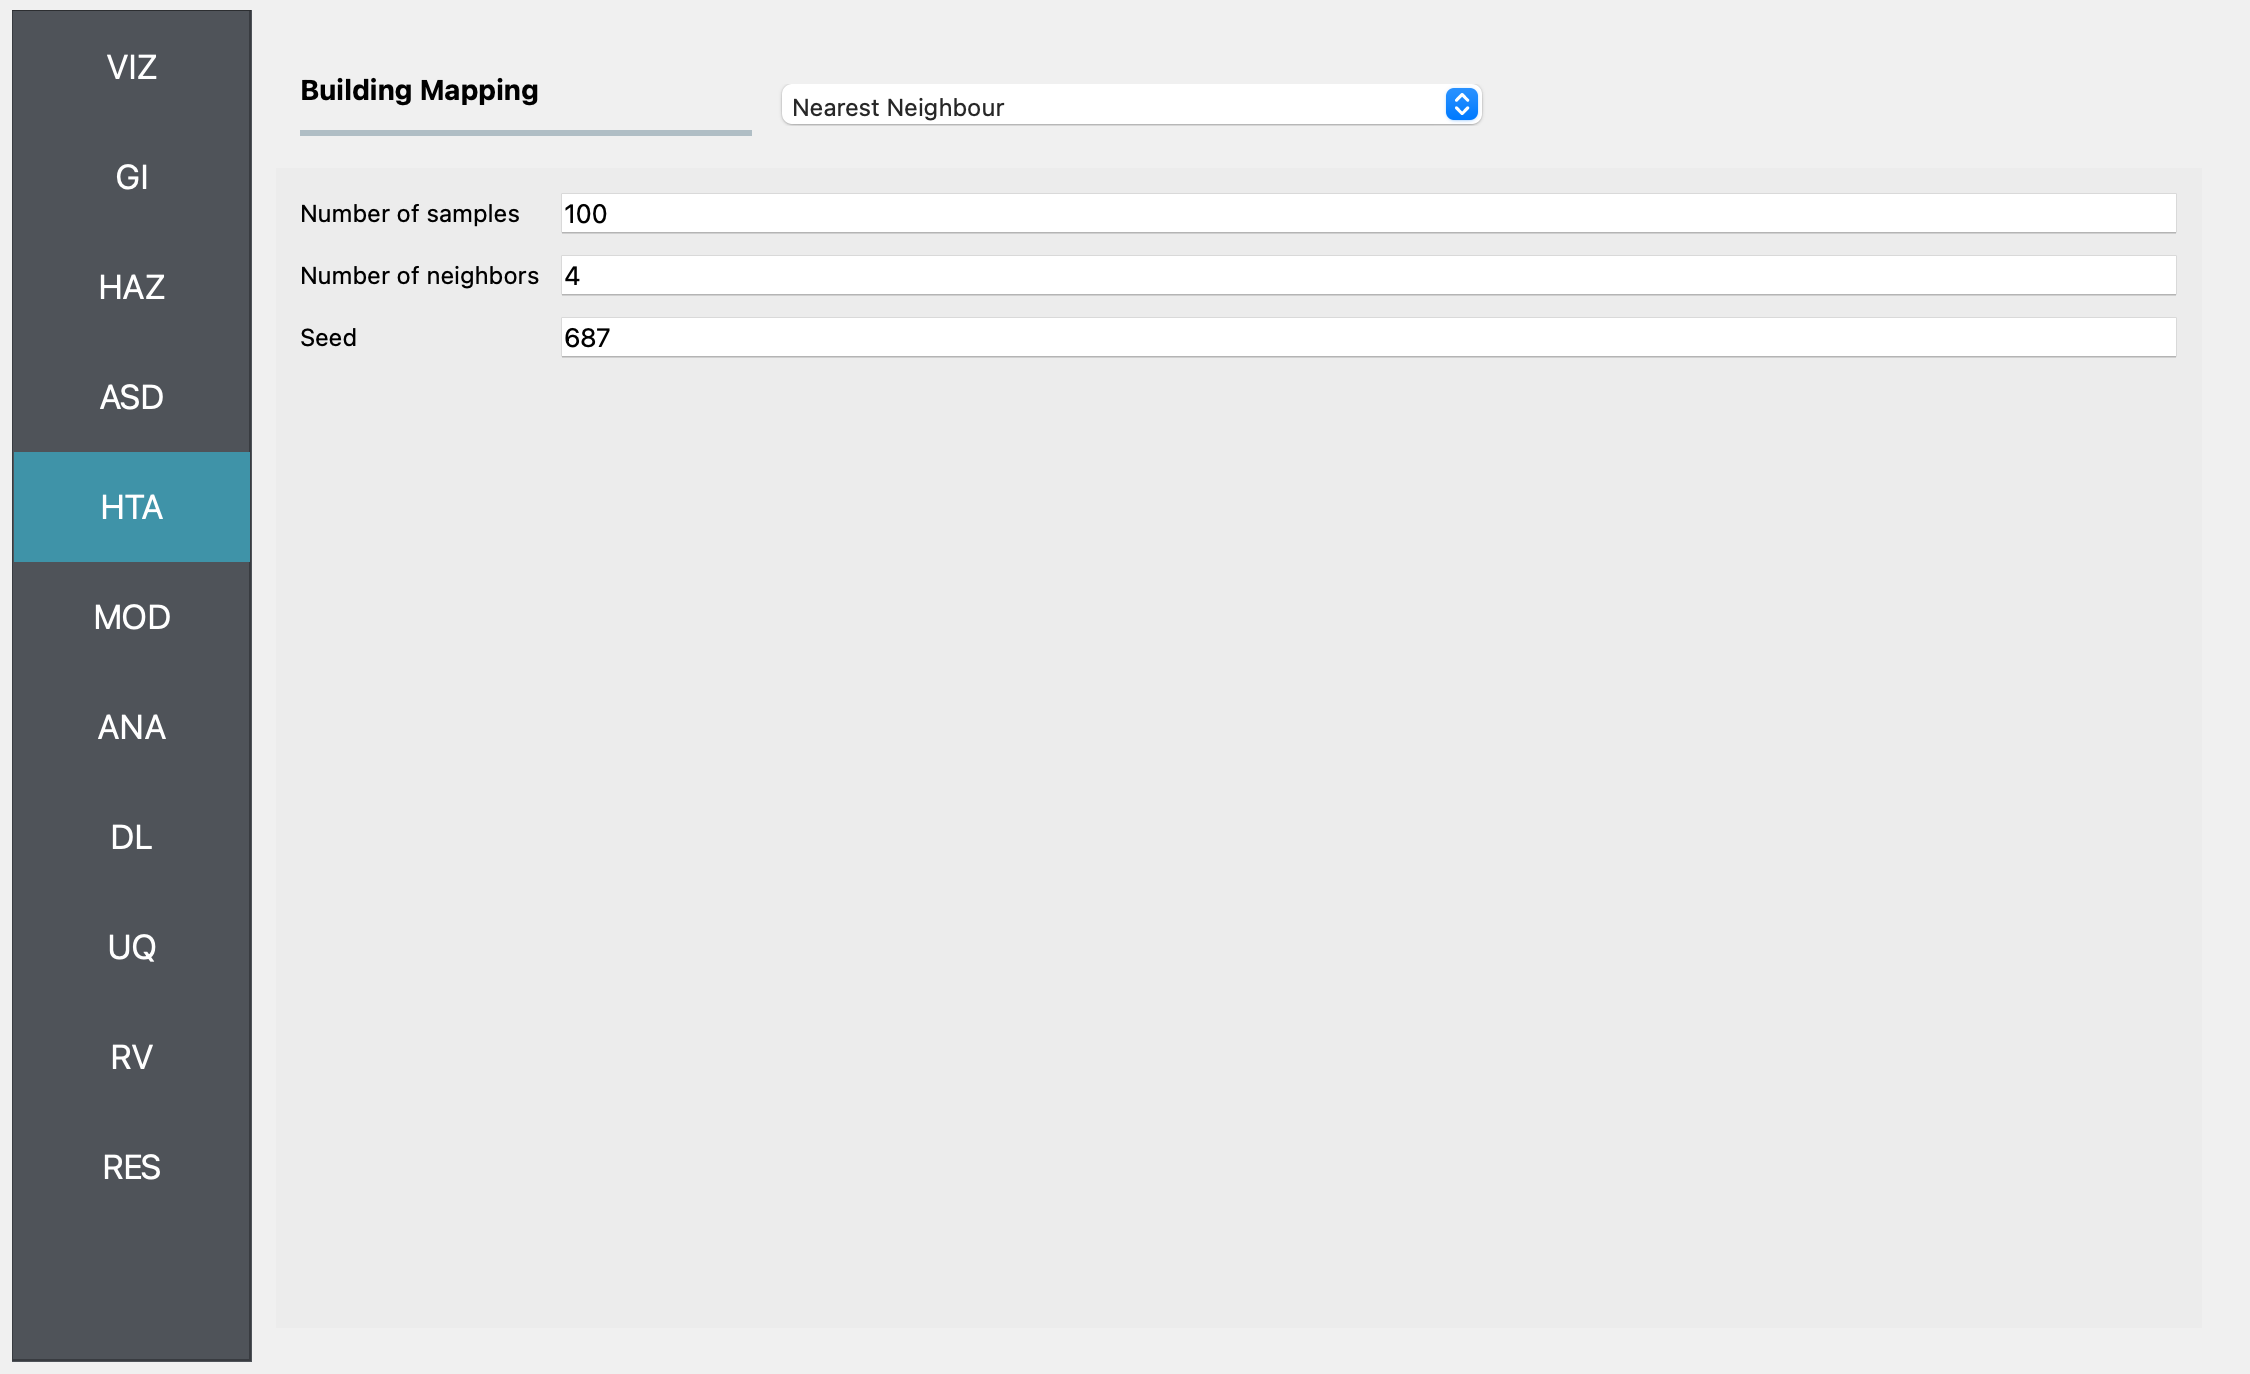
HTA Next, a hazard mapping algorithm is specified. Of the 3 options provided, only the Nearest Neighbor method option makes sense for the Hazard application chosen, one in which the event is specified at a grid of points. For the input shown in the following figure with 100 samples in 4 neighbors, i.e., randomly sampling 100 ground motions from the nearest four stations (each station has a large number of ground motion records specified in the HAZ).
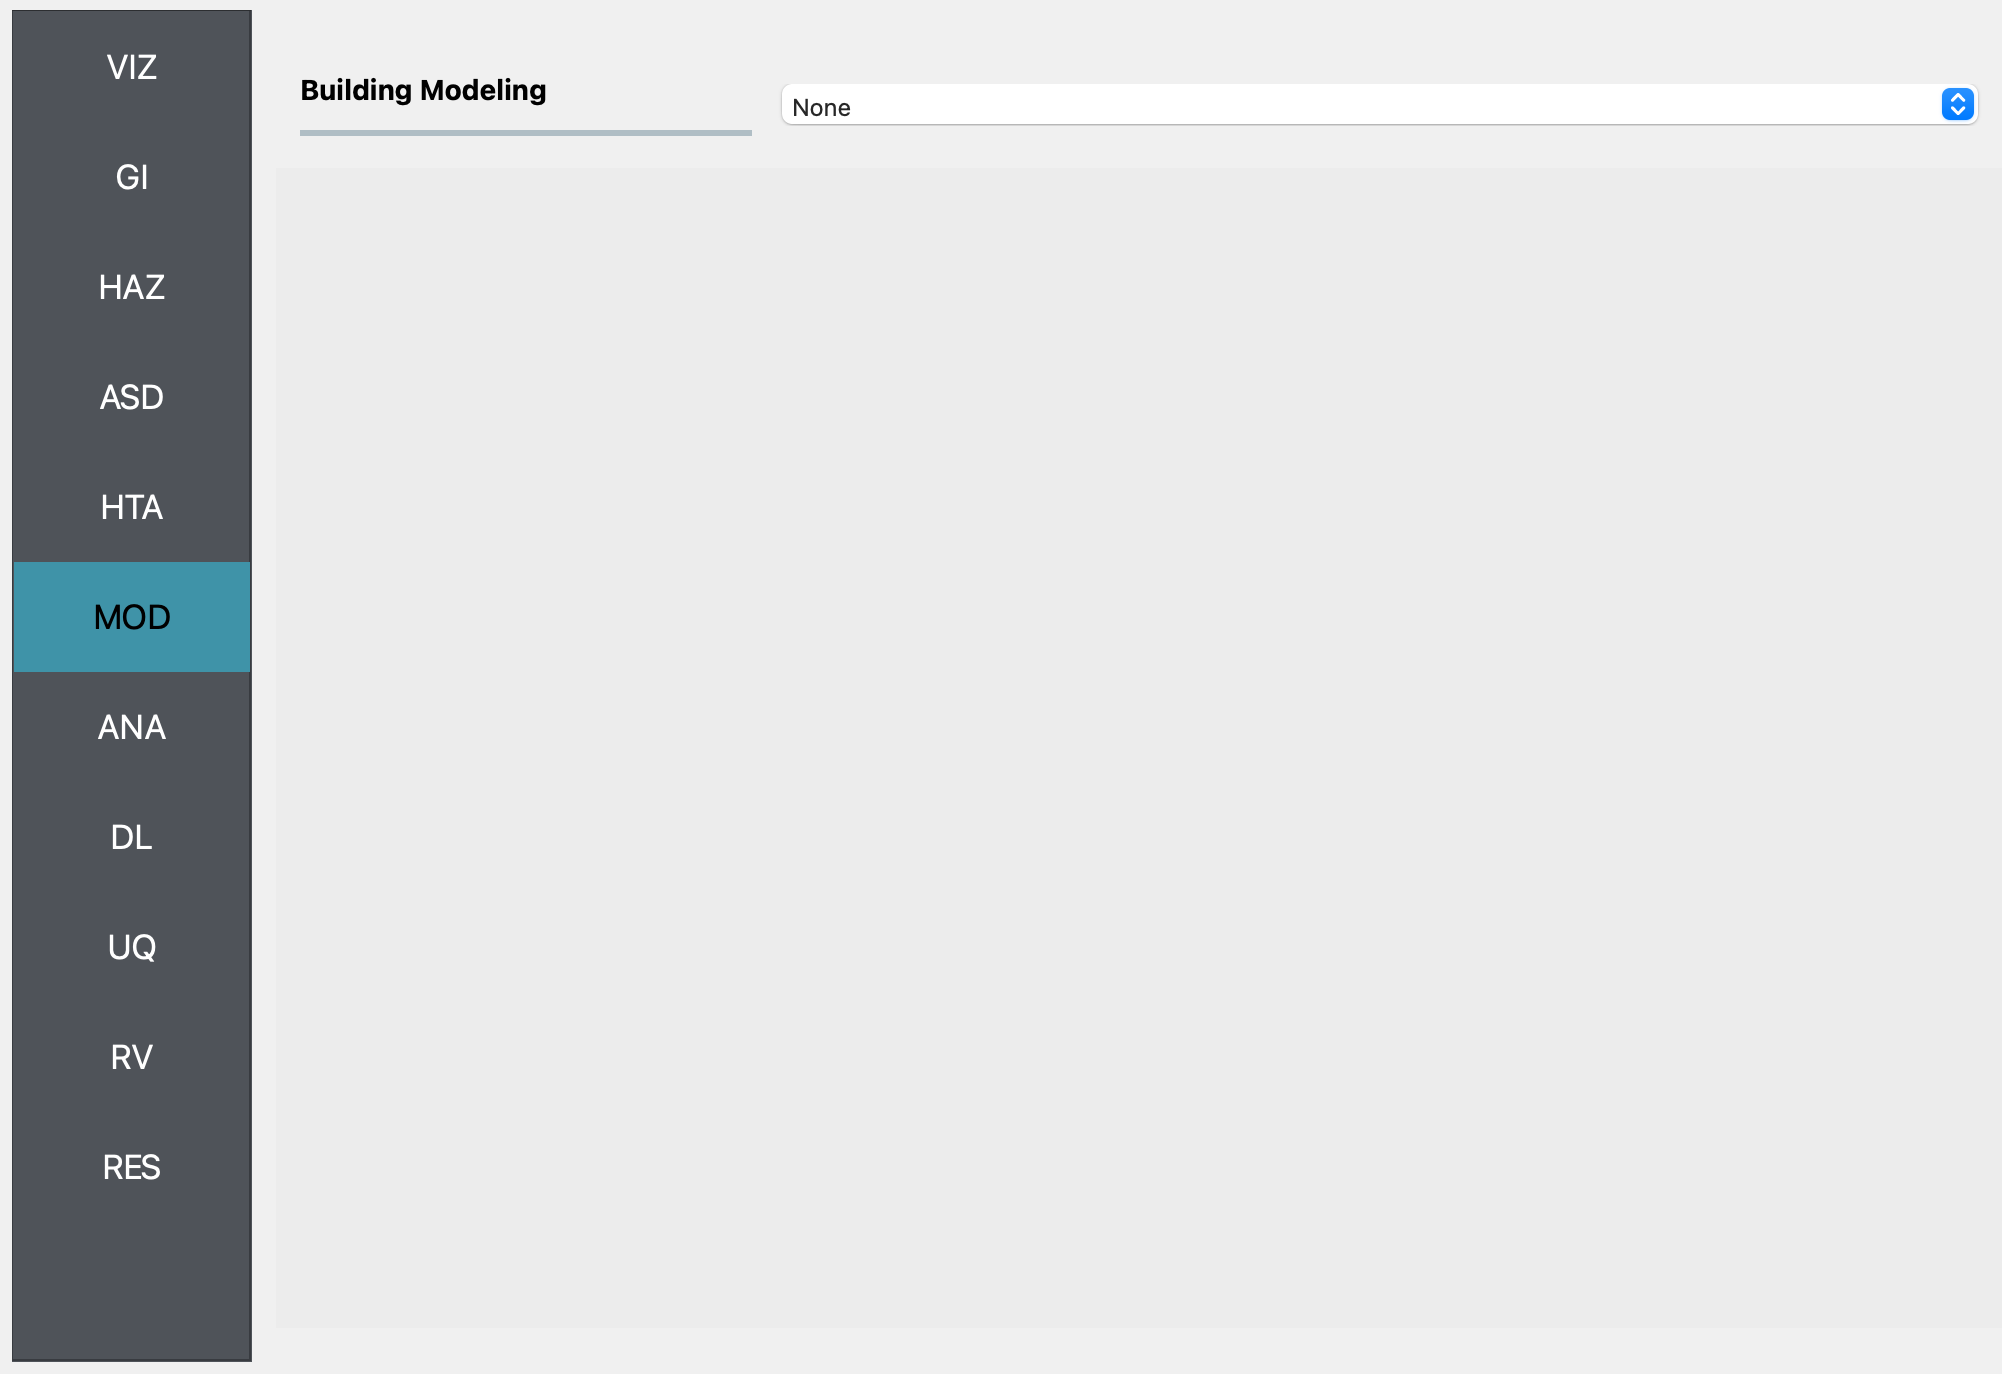
MOD The Asset Modeling dropdown should be set to None. For a Hazus-level evaluation, no finite element models are required; engineering demand parameters are derived directly from ground motion intensity.
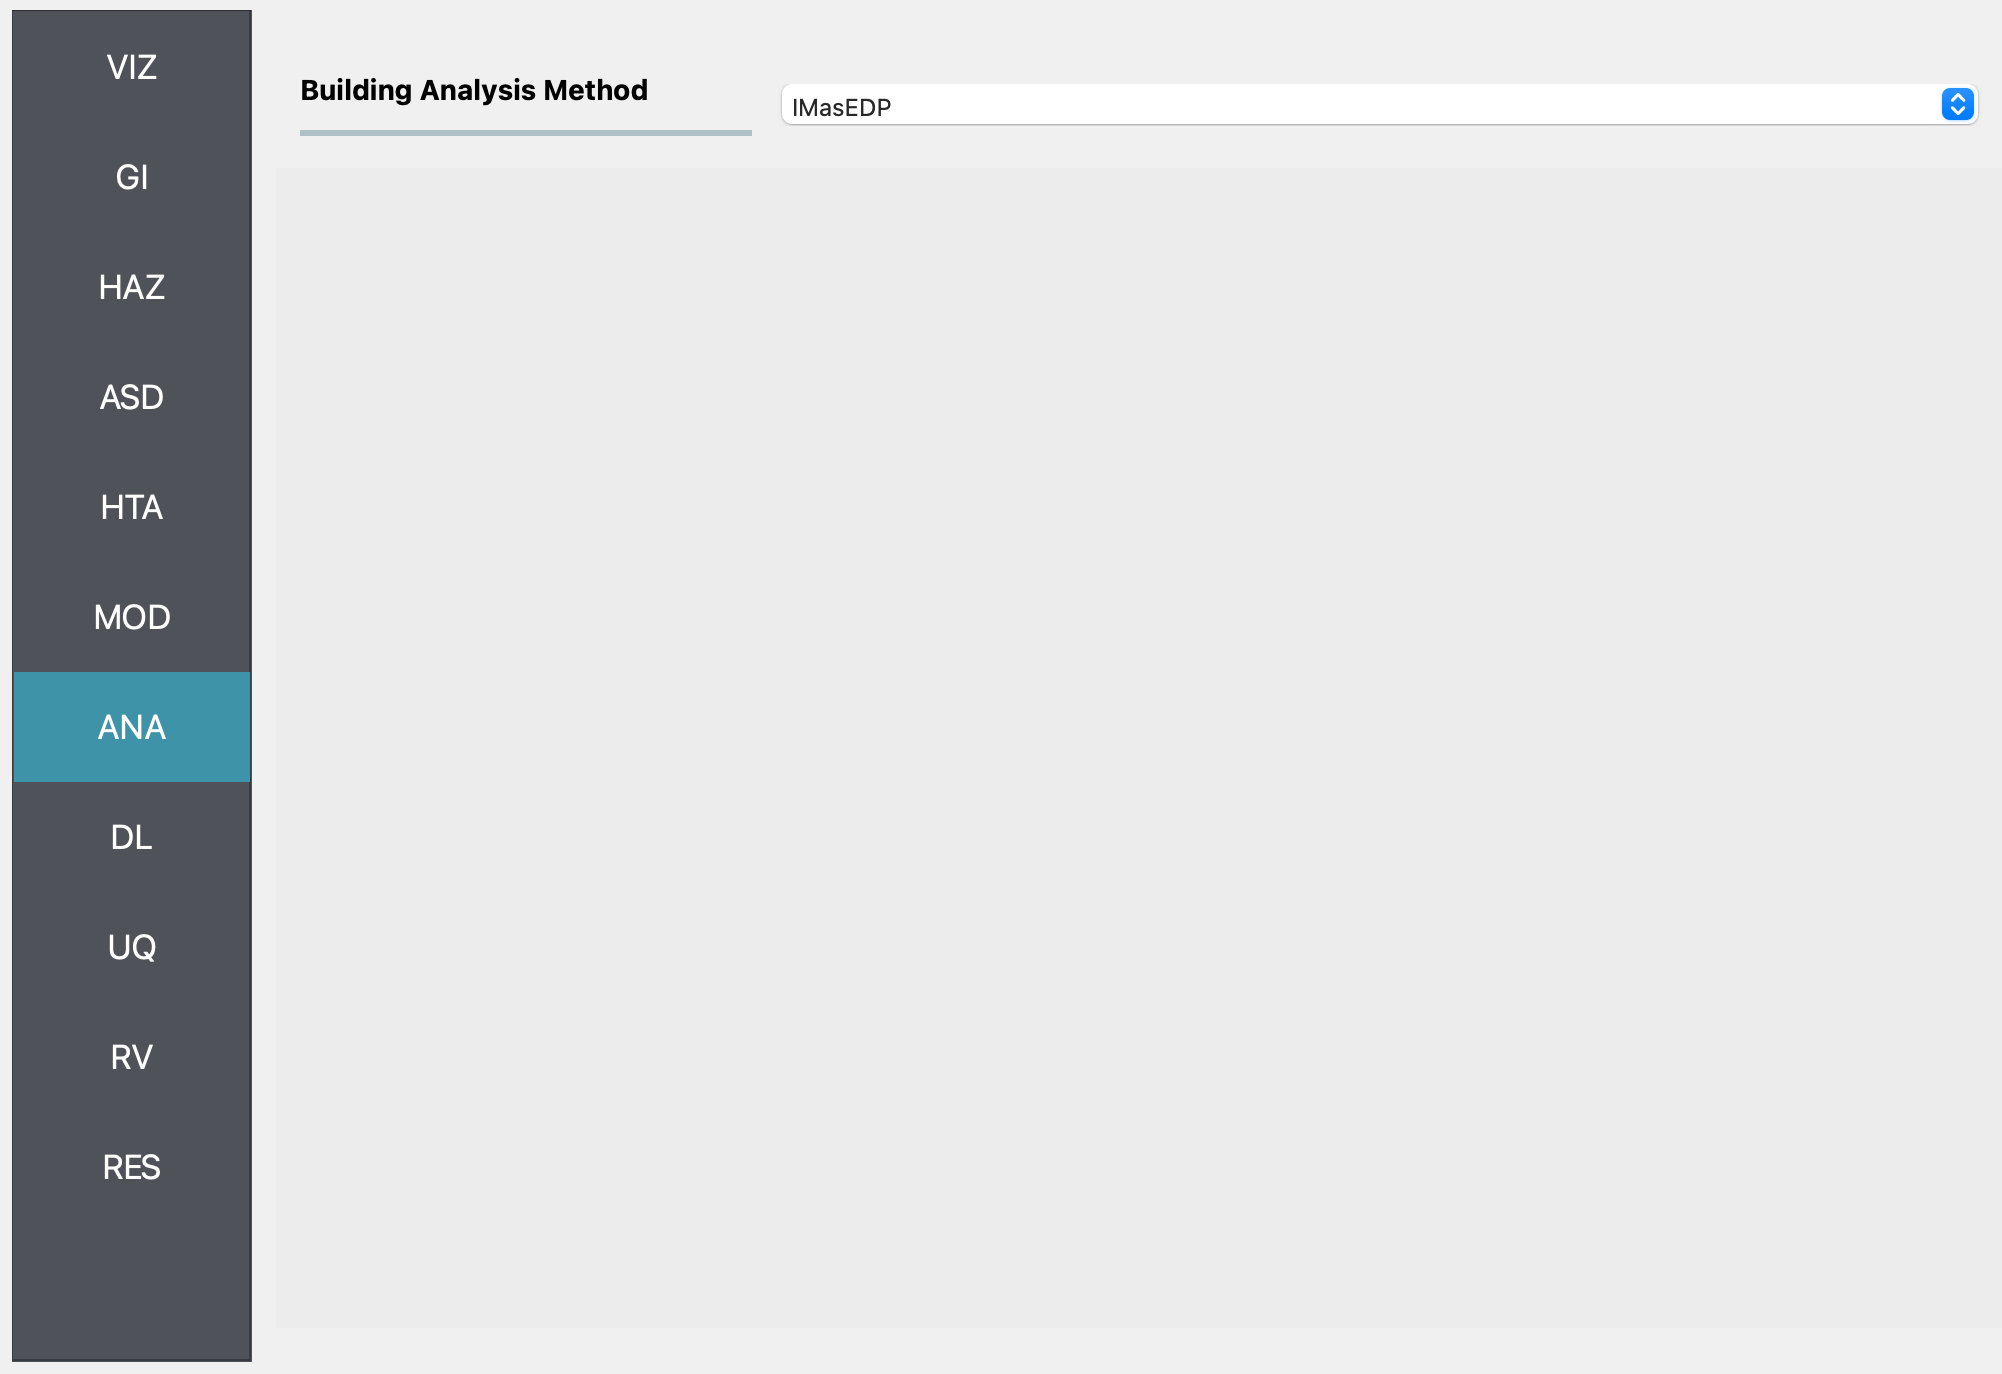
ANA In the analysis panel, IMasEDP, Intensity Measure as Engineering Demand Parameter, is selected from the dropdown. As mentioned previously, for a Hazus level evaluation no finite element analysis needs to be performed as the engineering demand parameters can be determined from the intensity of the ground motions alone.
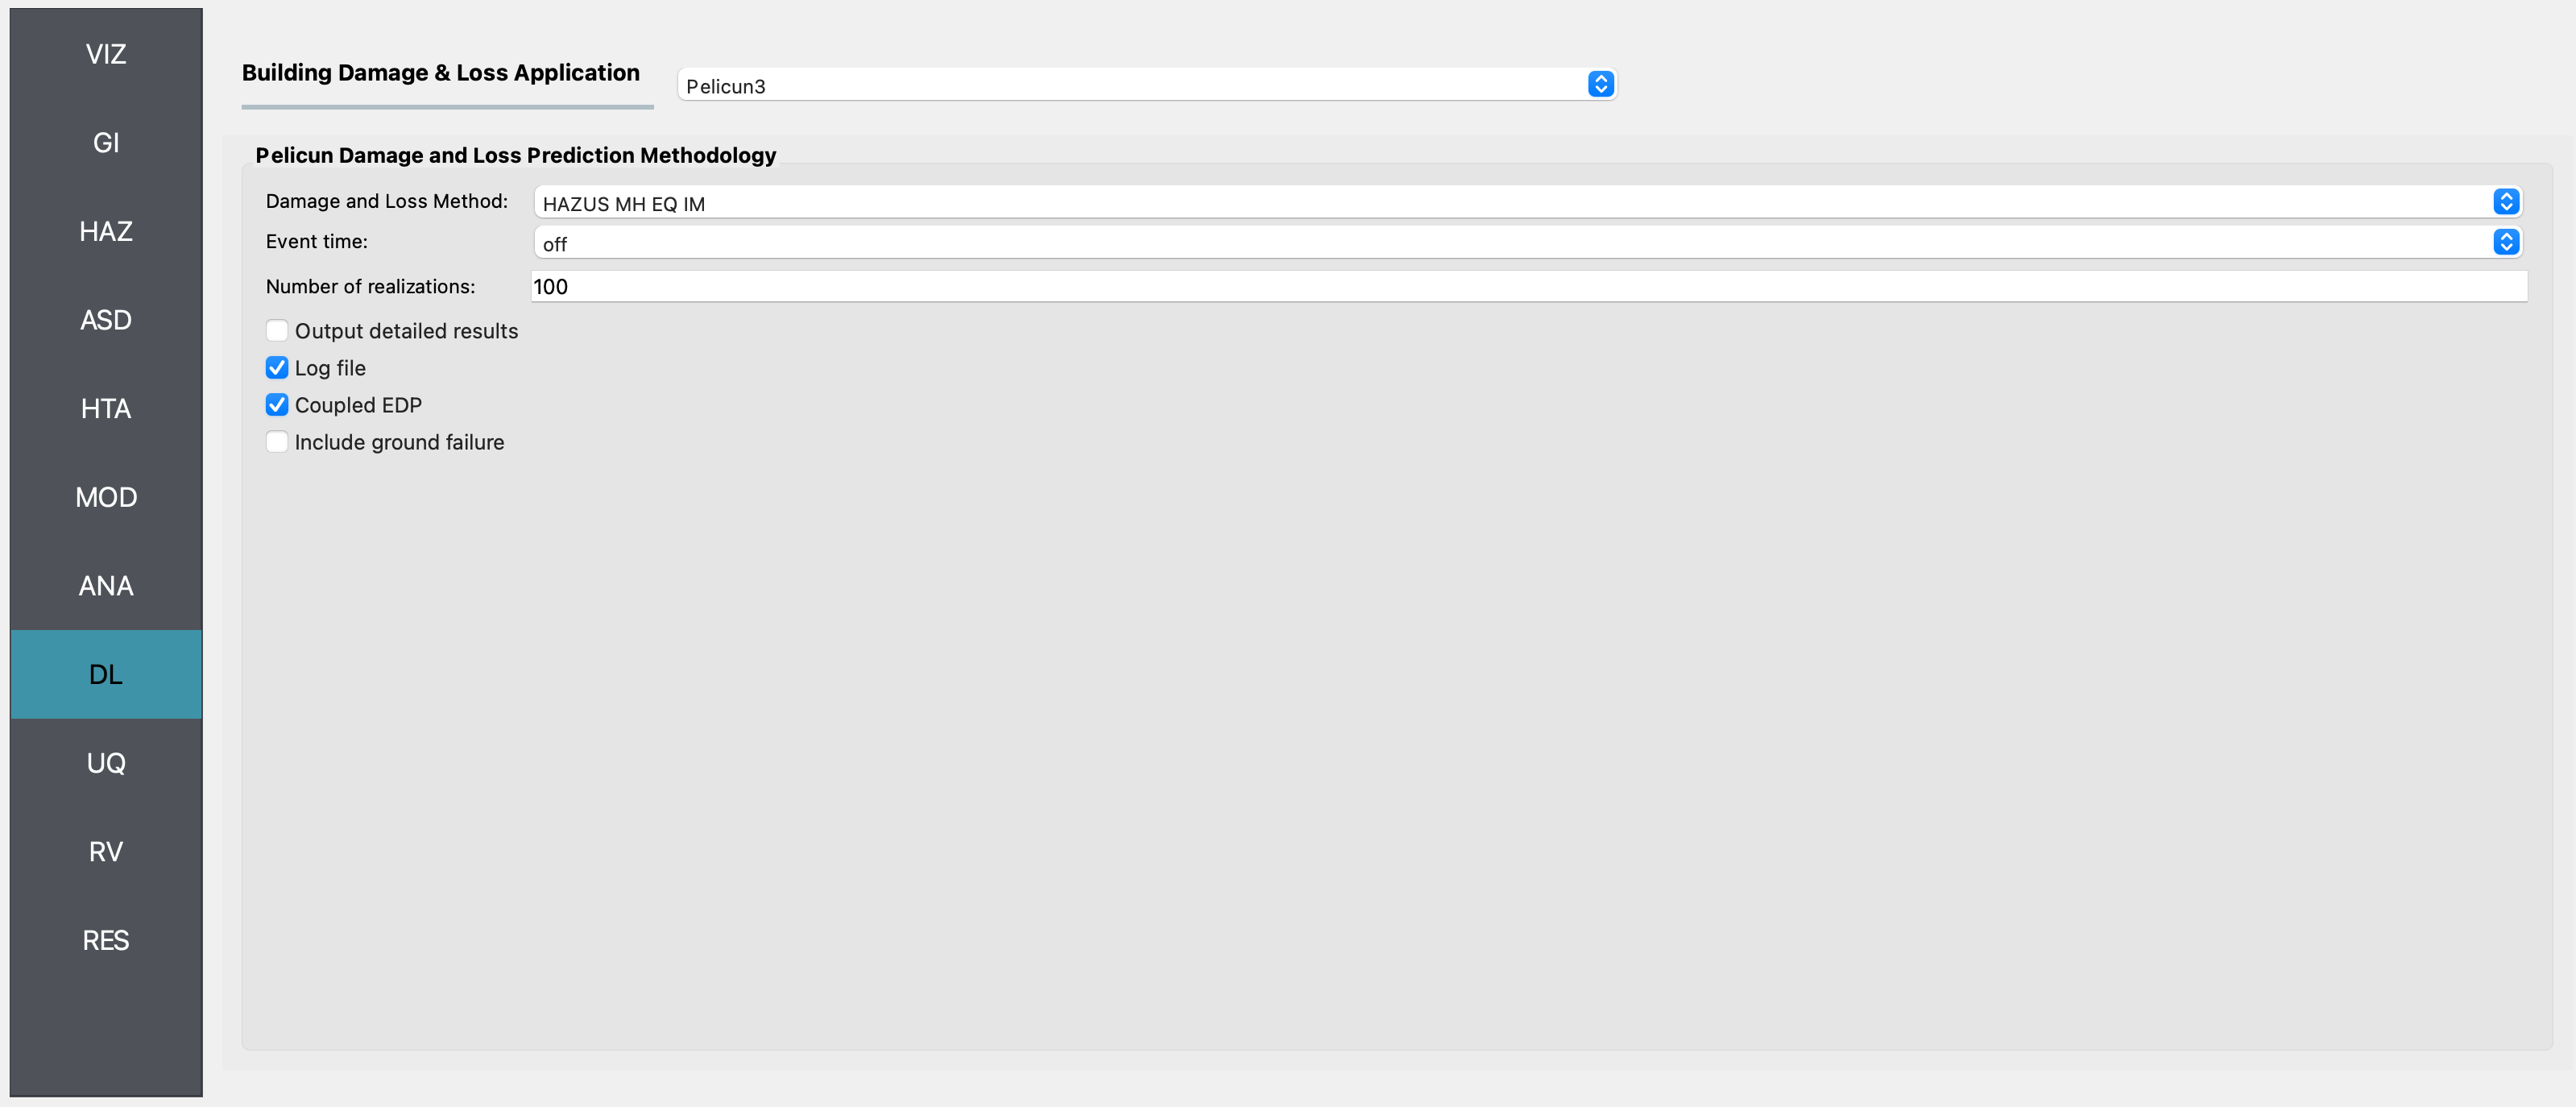
DL For the damage and loss panel, the Pelicun3 option is selected. In the panel presented for Damage and Loss Method, the Hazus Earthquake - Buildings ** option should be selected. In addition the **sample size, the number of loss realizations to be performed by Pelicun should be set to 100.
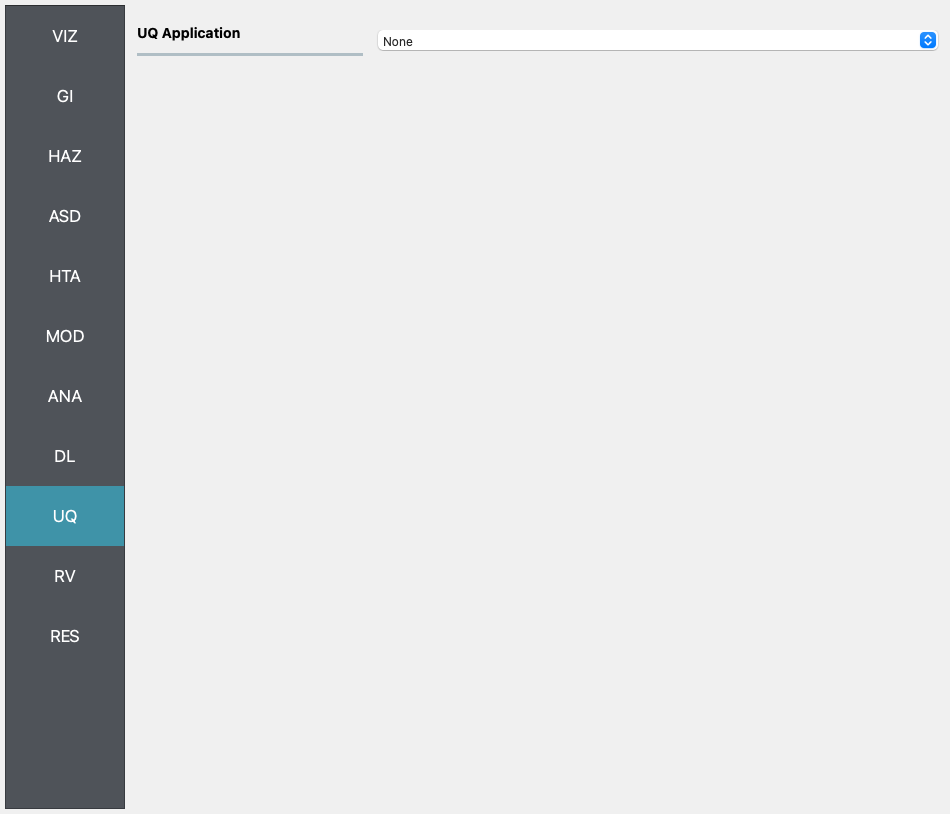
UQ For this example the UQ dropdown box should be set to None. For this workflow, uncertainty is specified in the NearestNeighbour and Pelicun options.
RV This panel remains empty, i.e. no random variables are added, for the example.
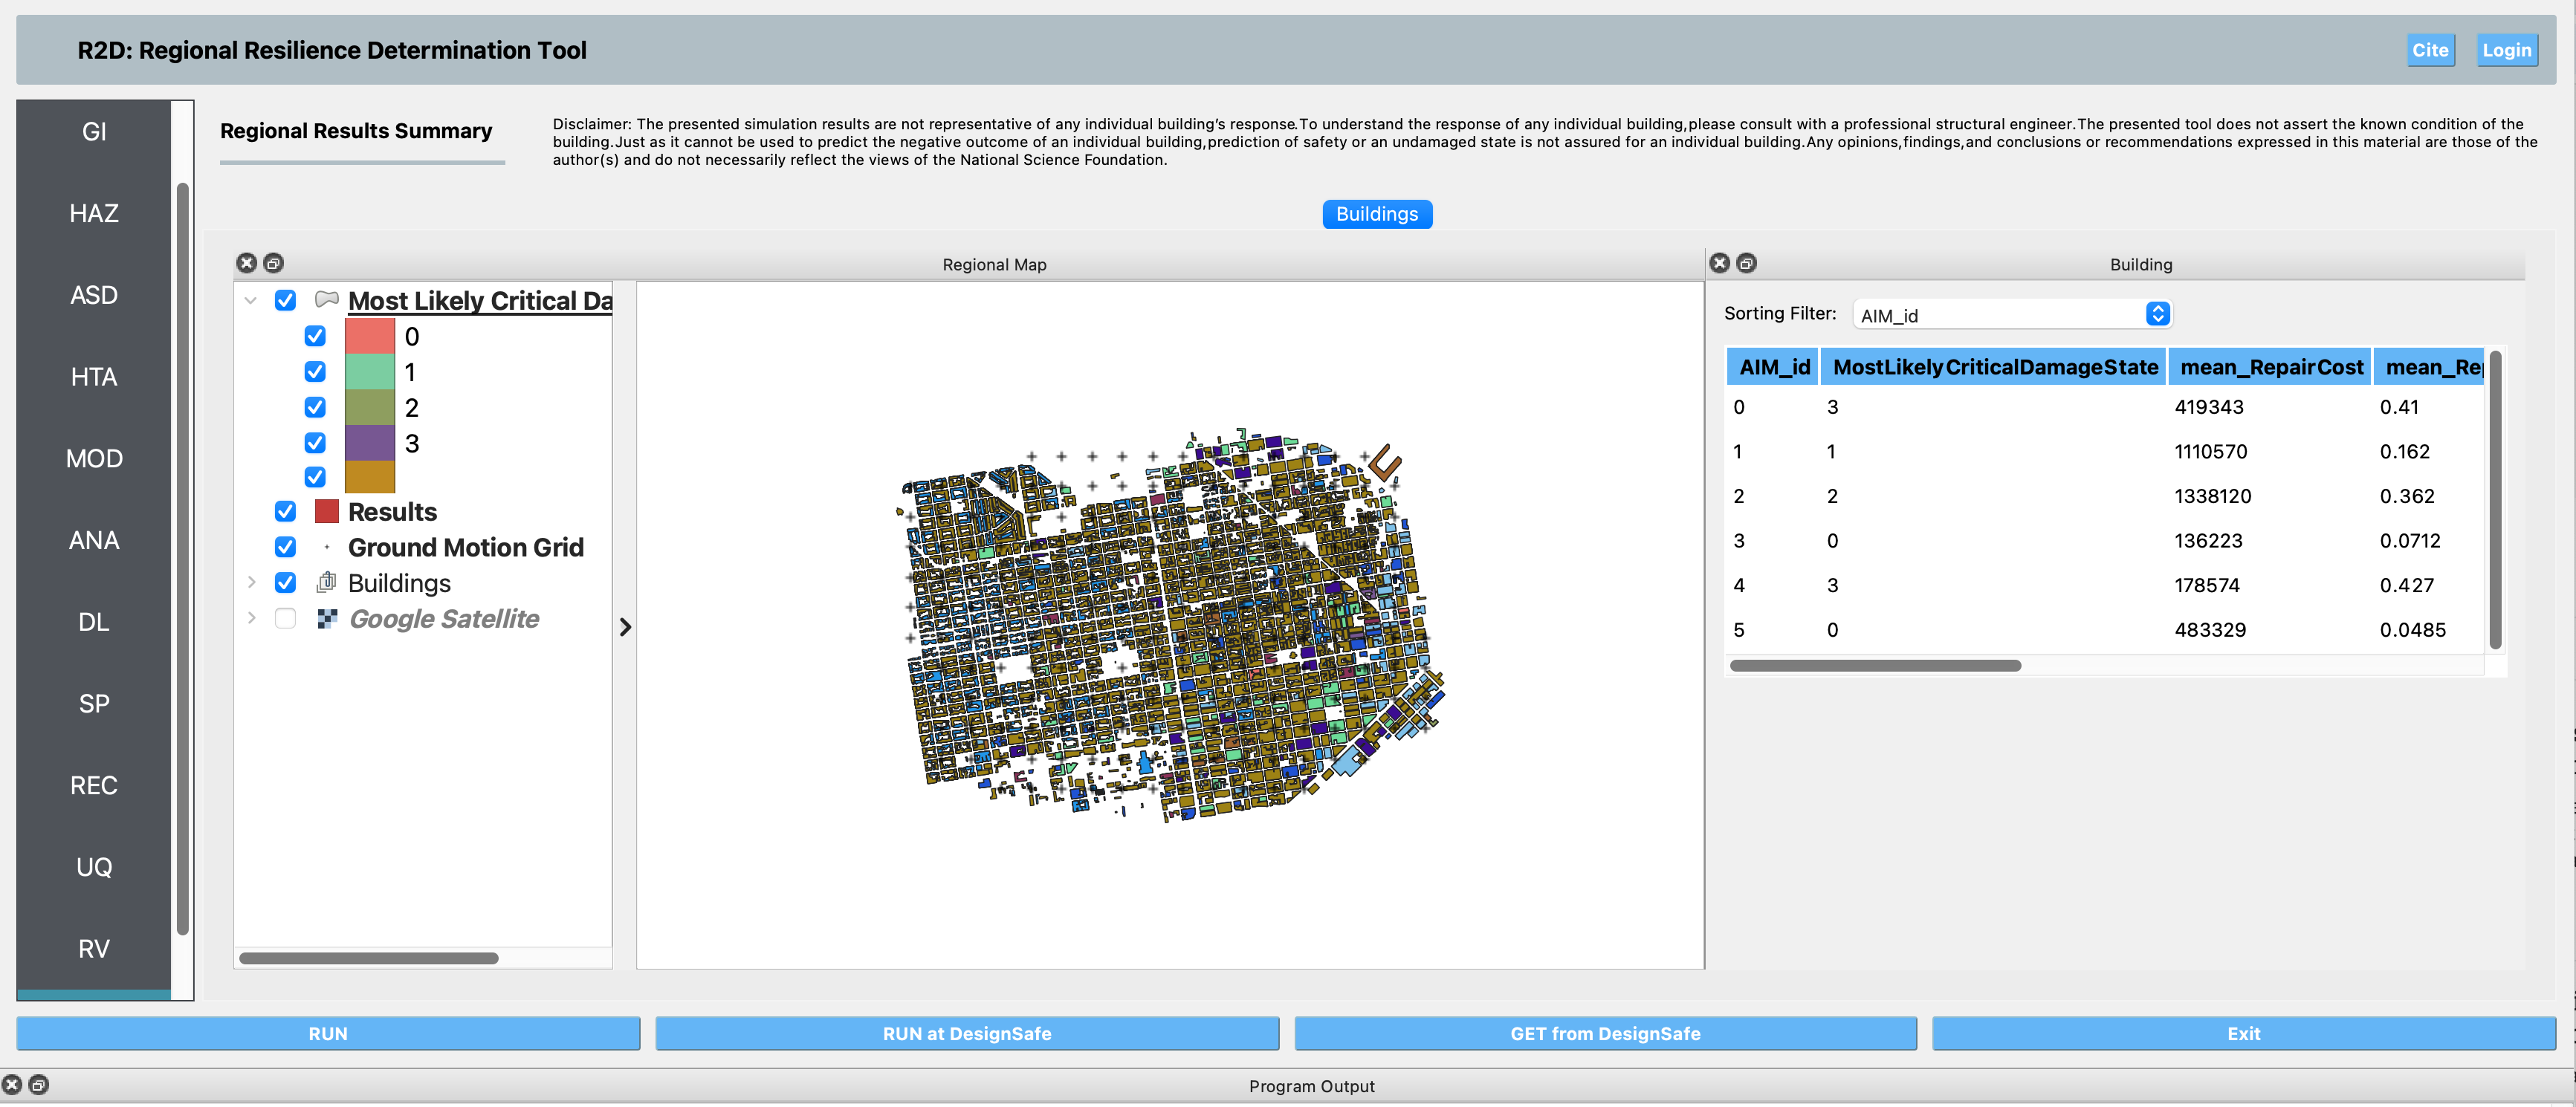
RES
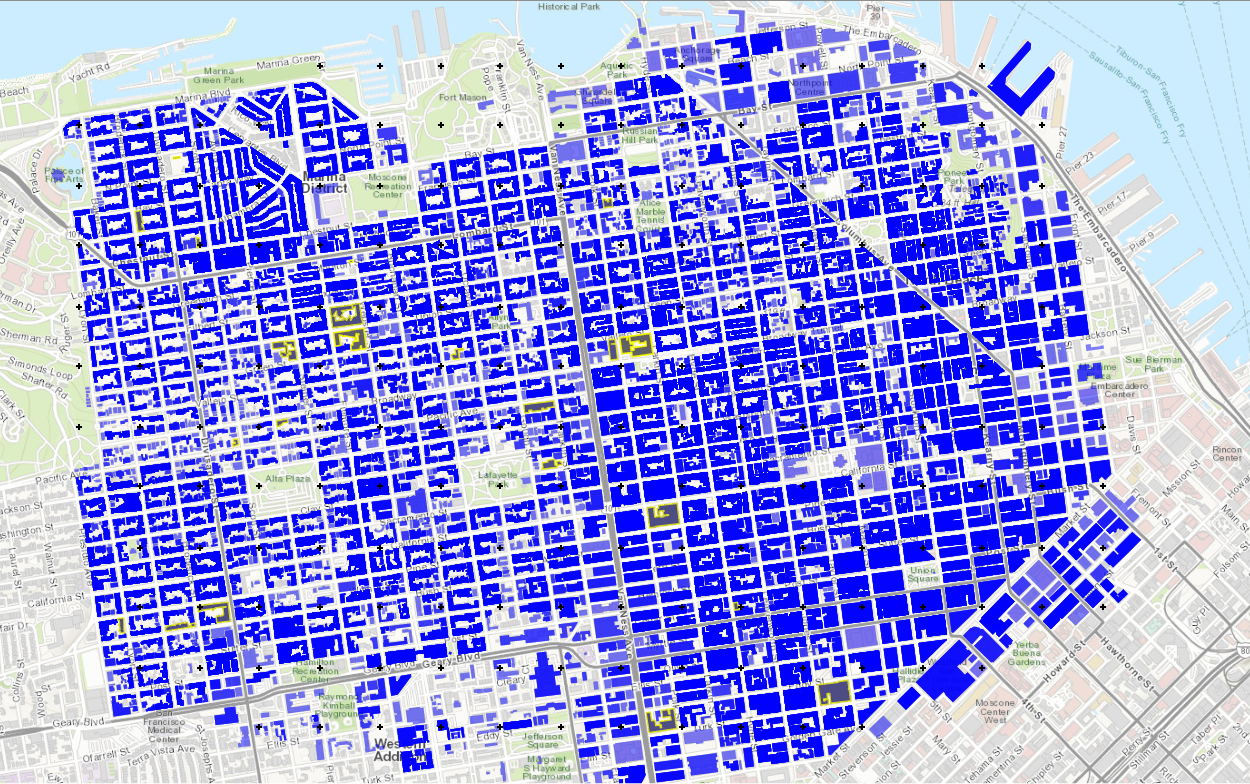
Once the user has run the example, by using the RUN button, or the RUN at DesignSafe and Get from DesignSafe buttons, the results panel will be automatically shown. In the Buildings tab are two windows, which can both be seperated from the main application. The first displays the QGIS window now showing should the VIZ panel be selected, to which a new layer has been added, the Resulta layer and by delselecting the other layers in this QGIS window, the most likely damage state for the 25 buildings (buildings 8000-8024 in the ASD panel) selected to be analyzed can be reviewed. The second window shows, in tabular form, the results for each building. By left or right clicking in any of the columns of the table, statistical data for the entries, e.g. min, max, mean, mode and histograms, may be obtained.