2.2. Asset Description
This section describes how a large-scale building inventory was constructed in two phases. The initial phase of this work involved identifying the attributes needed. The second phase comprised obtaining these attributes for each building using machine learning and computer vision techniques to create a core set of attributes. The remaining attributes were then obtained using other data sources as discussed below.
2.2.1. Phase I: Attribute Definition
All the attributes required for loss estimation were first identified to develop the Building Inventory data model. This Building Inventory data model presented in Table 2.2.1.1 provides a set of attributes that are assigned to each asset to form the building inventory file serving as input to the workflow. For each attribute, a row in the table is provided. Each row has a number of columns: the attribute name, description, format (such as alphanumeric, floating-point number), the data source used to define that attribute. An expanded version of Table 2.2.1.1 with the full details of this data model is available on DesignSafe PRJ-3314.
Attribute |
Description |
Format |
|---|---|---|
BldgID |
Building unique ID. The first four characters will be “NJBF,” followed by a 9-digit zero-padded number. |
NJBF######### |
Address |
Typically assessor field for property location. This is distinct from Street Address in MODIV which is associated with the billing address |
Alphanumeric |
City |
Typically assessor field for property location city. |
Alphanumeric |
State |
Typically assessor field for property location - state abbreviation. |
Alphanumeric |
Latitude |
Latitude of the Building Centroid (inside polygon). |
Floating point number (Decimal Degrees) |
Longitude |
Longitude of the Building Centroid (inside polygon). |
Floating point number (Decimal Degrees) |
OccupancyClass |
Subclassifications of buildings across various categories of Residential (RES), Commercial (COM), Industrial (IND), Agriculture (AGR), Government (GOV), Education (EDU), Religious/Non-Profit (REL). |
Choices: RES1, RES2, RES3A, RES3B, RES3C, RES3D, RES3E, RES3F, RES4, RES5, RES6, COM1, COM2, COM3, COM4, COM5, COM6, COM7, COM8, COM9, COM10, IND1, IND2, IND3, IND4, IND5, IND6, AGR1, REL1, GOV1, GOV2, EDU1, EDU2 |
BuildingType |
Core construction material type; Wood, Concrete, Steel, Masonry, Manufactured Housing. |
Choices: 3001, 3002, 3003, 3004, 3005 |
UseCode |
Class 4 Use Codes (Field 67) applicable to commercial buildings only, describing specific use of commercial properties. |
Integer (3-digit) |
BldgClass |
Building class according to NJ Appraisal Manual (see Vol 2) |
Integer (3-digit) |
EssentialClass |
Designates several classes of essential facilities in the region based on open data to ensure they are properly modeled. |
Choices: PS, EOC, HO, HS, SCH |
DesignLevel |
Classification of level of engineering used in design process: Choices: Engineered (E), Pre-Engineered, (PE) Marginally Engineered (ME), Non-Engineered (NE) |
Choices: E, PE, ME, NE |
YearBuiltNJDEP |
Assessor-provided Year of Construction from NJDEP Footprints |
Integer (4-digit) |
YearBuiltMODIV |
Assessor-provided Year of Construction from MODIV |
Integer (4-digit) |
NumberofStories0 |
Assessor-provided number of stories |
Integer |
NumberofStories1 |
Number of stories estimated via image processing |
Integer |
NoUnits |
Number of units in the property (commercial or residential) |
Integer |
PlanArea0 |
Plan area in square feet from assessor databases |
Floating point number |
PlanArea1 |
Plan area in square feet from footprint data |
Floating point Number |
FoundationType |
Classification using 7 types referenced by flood model |
Integer (4-digit) |
SplitLevel |
Specifies if residential construction is split-level |
Choices: Yes, No |
ElevationR0 |
Elevation of the bottom plane of the roof (lowest edge of roof line) relative to grade (ft) |
Floating point number |
ElevationR1 |
Elevation of highest point of the roof (peak of gable or apex of hip) relative to grade (ft) |
Floating point Number |
FirstFloorHt0 |
Height above grade estimated from elevation certificate or inferred from foundation type (in feet): Defined as top of lowest/bottom floor |
Floating point Number |
FirstFloorHt1 |
Height of top of floor as estimated from base of door height above grade, based on streetview imagery (in feet) |
Floating point Number |
FloodZone |
Flood zone specified on FEMA FIRM based on building location |
Choices: 6101, 6102, 6103, 6104, 6105, 6106, 6107, 6108, 6109, 6110, 6111, 6112, 6113, 6114, 6115, 6199 |
DWSI |
DesignWindSpeed I in mph |
Floating point number |
DWSII |
DesignWindSpeed II in mph |
Floating point number |
DWSIII |
DesignWindSpeed III in mph |
Floating point number |
DWSIV |
DesignWindSpeed IV in mph |
Floating point number |
WindZone |
HAZUS-defined Wind Zone (For Manuactured homes, based on HUD Designation) |
Choices: I, II, III |
AvgJanTemp |
Average temperature in January below or above critial value of 25F. |
Choices: Above, Below |
RoofShape |
Roof classified into equivalent hip, gable or flat |
Choices: Hip, Gable, Flat |
RoofSlope |
Slope of roof covering the majority of the dwelling |
Floating point number |
RoofCover |
Roof covering, specified only for residential construction. |
Choices: 5701, 5702, 5703, 5704 |
MeanRoofHt |
Mean height of roof system in ft |
Floating point number |
WindowArea |
Percentage of walls defined by window openings |
Floating point number (decimal<1) |
Garage |
Assessor-provided type of garage. |
Floating point number |
TerrainRoughness (z0 x100) |
HAZUS-defined terrain classifications (z0) multiplied by 100 based on LULC data |
Choices: 3, 15, 35, 70, 100 |
AnalysisDefault |
Defines the default level of fidelity for analysis |
Choices: 1, 2, 3 |
AnalysisAdopted |
Defines the adopted level of fidelity for analysis |
Choices: 1, 2, 3 |
Modifications |
Record of manual updates, corrections or modifications to record |
Alphanumeric (freeform) |
HazusClass-W |
Hazus building classes as defined for wind hazards |
CHOICES: WSF1, WSF2, WMUH1, WMUH2, WMUH3, WMUH1NE, WMUH2NE, WMUH3NE, WMUH4NE, MSF1, MSF2, MMUH1, MMUH2, MMUH3, MLRM1, MLRM2, MLRI, MERBL, MERBM, MERBH, MECBL, MECBM, MECBH, MMUH1NE, MMUH2NE, MMUH3NE, CERBL, CERBM, CERBH, CECBL, CECBM, CECBH, SPMBS, SPMBM, SPMBL, SERBL, SERBM, SERBH, SECBL, SECBM, SECBH, MHPHUD, MH76HUD, MH94HUD-I, MH94HUD-II, MH94HUD-III, HUEFFS, HUEFSS, HUEFSM, HUEFSL, HUEFHS, HUEFHM, HUEFHL, HUEFPS, HUEFEO |
RoofSystem |
Underlying roof structure, applies only to masonry buildings |
Choices: Wood, OWSJ |
HazardProneRegion |
Defines Hazard Prone Regions (HPR) for the purposes of Hazus wind vulnerability assignments for WSF1-2 |
Choices: yes, no |
WindBorneDebris |
Defines Wind Borne Debris (WBD) for the purposes of Hazus wind vulnerability assignments for WSF1-2 |
Choices: yes, no |
SecondaryWaterResistance |
Defines Secondary Water Resistance (SWR) for the purposes of Hazus wind vulnerability assignments for WSF1-2, WMUH1-3, MSF1-2, MMUH1-3 |
Choices: yes, no |
RoofCover |
Defines roof cover for the purposes of Hazus wind vulnerability assignments for WMUH1-3, MMUH1-3, MERBL-M-H, MECBL-M-H, MLRI, MLRM1, MLRM2, SERBL-M-H, SECBL-M-H, CECBL-M-H, CERBL-M-H and Fire Stations (HUEFFS), Elementary Schools (HUEFSS), 2-story High School (HUEFSM) and 3-story High School (HUEFSL) and Hospitals (small - HUEFHS, medium - HUEFHM, large - HUEFHL) and Police Stations (HUEFPS), Emergency Operation Centers (HUEFEO) |
Choices: N/A, BUR, SPM |
RoofQuality |
Defines roof cover quality for the purposes of Hazus wind vulnerability assignments for WMUH1-3, MMUH1-3, MLRI |
Choices: N/A, poor, good |
RoofDeckAttachmentW |
Defines Roof Deck Attachment (RDA) for wood for the purposes of Hazus wind vulnerability assignments for WSF1-2, WMUH1-3, MMUH1-3, MSF1-2, MLRM1, MLRM2 |
Choices: A, B, C, D |
RDA-OWSJ |
Defines Roof Deck Attachment (RDA) for OWSJ for the purposes of Hazus wind vulnerability assignments for MSF1-2 |
Choices: smtl standard, smtl superior, cshl standard, cshl superior |
RoofToWallConnection |
Defines Roof to Wall Connection (R2WC) for the purposes of Hazus wind vulnerability assignments for WSF1-2, WMUH1-3, MMUH1-3, MSF1-2, MLRM1, MLRM2 |
Choices: strap, toe-nail |
Shutters |
Defines use of window opening protection for the purposes of Hazus wind vulnerability assignments for WSF1-2, WMUH1-3, MMUH1-3, MSF1-2, MERBL-M-H, MECBL-M-H, MMUH1-3,MLRM1, MLRM2, SERBL-M-H, SECBL-M-H, CECBL-M-H, CERBL-M-H, SPMBS-M-L, MH94HUDI-II-III, MH76HUD, MHPHUD and Fire Stations (HUEFFS), Elementary Schools (HUEFSS), 2-story High School (HUEFSM) and 3-story High School (HUEFSL) and Hospitals (small - HUEFHS, medium - HUEFHM, large - HUEFHL) and Police Stations (HUEFPS), Emergency Operation Centers (HUEFEO) |
Choices: yes, no |
AugmentedGarage |
Defines presence of attached garage for the purposes of Hazus wind vulnerability assignments for WSF1-2, MSF1-2 |
Choices: none, SFBC 1994, standard, weak |
MasonryReinforcing |
Defines presence of reinforcement in masonry walls for the purposes of Hazus wind vulnerability assignments for MSF1-2, MLRI, MLRM1, MLRM2, MMUH1-3 |
Choices: yes, no |
OWSJ-r |
Defines property of OWSJ required for Hazus wind vulnerability assignments for MSF1-2 |
Choices: cshl, smtl |
RoofDeckAttachmentM |
Defines Metal Roof Deck Attachment (RDA) for purposes of Hazus wind vulnerability assessments for MLRI, MERBL-M-H, MECBL-M-H, MLRM1, MLRM2, SERBL-M-H, SECBL-M-H, SPMBS-M-L and Fire Stations (HUEFFS), Elementary Schools (HUEFSS), 2-story High School (HUEFSM) and 3-story High School (HUEFSL) and Hospitals (small - HUEFHS, medium - HUEFHM, large - HUEFHL) and Police Stations (HUEFPS), Emergency Operation Centers (HUEFEO) |
Choices: standard, superior |
RoofDeckAge |
Defines roof deck age for the purposes of Hazus wind vulnerability assessments for MLRM1, MLRM2, SPMBS-M-L and Fire Stations (HUEFFS), Elementary Schools (HUEFSS) |
Choices: new/avg, old |
UnitClass |
Defines number of units in strip mall for purposes of Hazus wind vulnerability assessments for MLRM2 |
Choices: single, multi |
JoistSpace |
Defines joist spacing for multi-unit strip malls for purposes of Hazus wind vulnerability assessments for MLRM2 |
Choices: N/A, 4, 6 |
WindDebris |
Defines likely sources of wind debris for purpose of Hazus wind vulnerability assessments for MERBL-M-H, MECBL-M-H, MLRM1, MLRM2, SERBL-M-H, SECBL-M-H, CECBL-M-H, CERBL-M-H and Fire Stations (HUEFFS), Elementary Schools (HUEFSS), 2-story High School (HUEFSM) and 3-story High School (HUEFSL) and Hospitals (small - HUEFHS, medium - HUEFHM, large - HUEFHL) and Police Stations (HUEFPS), Emergency Operation Centers (HUEFEO) |
Choices: Res/Comm, Varies by Direction, Residential, None, A, B, C, D |
WindowAreaRatio |
Defines window to wall ratio (WWR) for purpose of Hazus wind vulnerability assessments for MERBL-M-H, MECBL-M-H, SERBL-M-H, SECBL-M-H, CECBL-M-H, CERBL-M-H and Police Stations (HUEFPS), Emergency Operation Centers (HUEFEO) |
Choices: low, medium, high |
TieDowns |
Defines use of ties to connect mobile homes to foundations per HUD guidelnes for purpose of Hazus wind vulnerability assessments for MH94HUDI-II-III, MH76HUD, MHPHUD |
Choices: yes, no |
HazusClass-IN |
Hazus building classes as defined for inundation (flooding) |
Choices: SF1XA, SF1XV, SF2XA, SF2XV, SF2BA, SF2BV, SF2SA, SF2SV, MH, APT, HOT, NURSE, RETAIL, WHOLE, SERVICE, OFFICE, BANK, HOSP, MED, REC, THEAT, GARAGE, INDH, INDL, CHEM, PROC, CONST, AGRI, RELIG, CITY, EMERG, SCHOOL |
HazusClass-WA |
Hazus building classes as defined for wave action |
Choices: W1, W2, W3, MC1, MC2, MC3, S1, S2, S3, MH |
FloodType |
Assignment to flood zones as defined for Hazus damage/loss descriptions |
Choices: Riverine/A-Zone, Coastal/A-Zone, Coastal/V-Zone |
FirstFloorElev |
Assignment of first floor height as defined by Hazus |
Floating Point Number |
PostFIRM |
Assignment of FIRM phasing as defined by Hazus |
Choices: Yes, No |
NumberofStories |
Initalizing number of stories for Hazus analysis |
integer |
BasementType |
Assignement of basement type for Hazus analysis |
Choices: Basement, Split-Level Basement, No Basement |
OccupancyType |
Assignment of Occupancy type for Hazus analysis |
Choices: SF1XA, SF1XV, SF2XA, SF2XV, SF2BA, SF2BV, SF2SA, SF2SV, MH, APT, HOT, NURSE, RETAIL, WHOLE, SERVICE, OFFICE, BANK, HOSP, MED, REC, THEAT, GARAGE, INDH, INDL, CHEM, PROC, CONST, AGRI, RELIG, CITY, EMERG, SCHOOL |
Duration |
Assignment of storm suration for Hazus Analysis |
Short, Long |
WaveVelocity |
Definition of wave velocity in ft/s for Hazus Analysis |
Floating Point Number |
2.2.2. Phase II: Inventory Generation
This section describes how the large-scale building inventory was constructed for Atlantic County using a phased approach that used machine learning, a computer vision algorithm, and data distributions to generate all attributes required for the corresponding loss assessment. It is emphasized that the intent is to demonstrate how an inventory could be constructed and not to address potential errors, omissions, or inaccuracies in the source data, i.e., source data are assumed to be accurate, and no additional quality assurance was conducted outside of addressing glaring omissions or errors.
For each of the attributes identified in Table 2.2.1.1, a description of the attribute and information on how the data was identified and validated is presented.
Phase II: Footprint Selection
Inventory development began with the footprint data generated by the New Jersey Department of Environmental Protection (NJDEP). These NJDEP footprints include flood-exposed properties cataloged in two geodatabases encompassing approximately 453,000 footprints across the entire state:
1. BF_NJDEP_20190612: all building footprints within a 1% annual chance (AC) floodplain, as defined by FEMA Flood Insurance Rate Maps (FIRMs).
2. 02pct_20190520 Building_Footprints_02pct: buildings that are not in the first dataset but fall within a 200-ft buffer of the 1% AC floodplain boundary.
These databases were then combined, with only properties within the limits of Atlantic County retained to form the Flood-Exposed Inventory. This inventory was then extended to include other footprints within the county boundaries. The Microsoft (MS) Footprint Database was utilized as the primary source of Non-NJDEP footprint polygons. One observed shortcoming of the MS Footprint Database is that it incorrectly lumps together the footprints of closely spaced buildings. This issue was resolved by a combination of manual inspections and applying a separate roof segmentation algorithm to the satellite images obtained for the buildings. This resulted in the Atlantic County Inventory.
AI/ML Techniques Combined with Computer Vision
Most of the key building attributes were generated using SimCenter’s BRAILS. The following is a brief description of how these attributes were obtained and the methods utilized were validated.
Attribute: NumberOfStories
The number of floors of each building is determined using an object detection procedure implemented in BRAILS. A detection model that can automatically detect rows of building windows was established to generate the image-based detections of visible floor locations from street-level images. The model was trained on the EfficientDet-D7 architecture with a dataset of 60,000 images, using 80% for training, 15% for validation, and 5% for testing the model. In order to ensure faster model convergence, the initial weights of the model were set to the model weights of the (pretrained) object detection model that, at the time, achieved state-of-the-art performance on the 2017 COCO Detection set. For this specific implementation, the peak model performance was achieved using the Adam optimizer at a learning rate of 0.0001 (batch size: 2), after 50 epochs. Fig. 2.2.2.1 shows examples of the floor detections performed by the model.
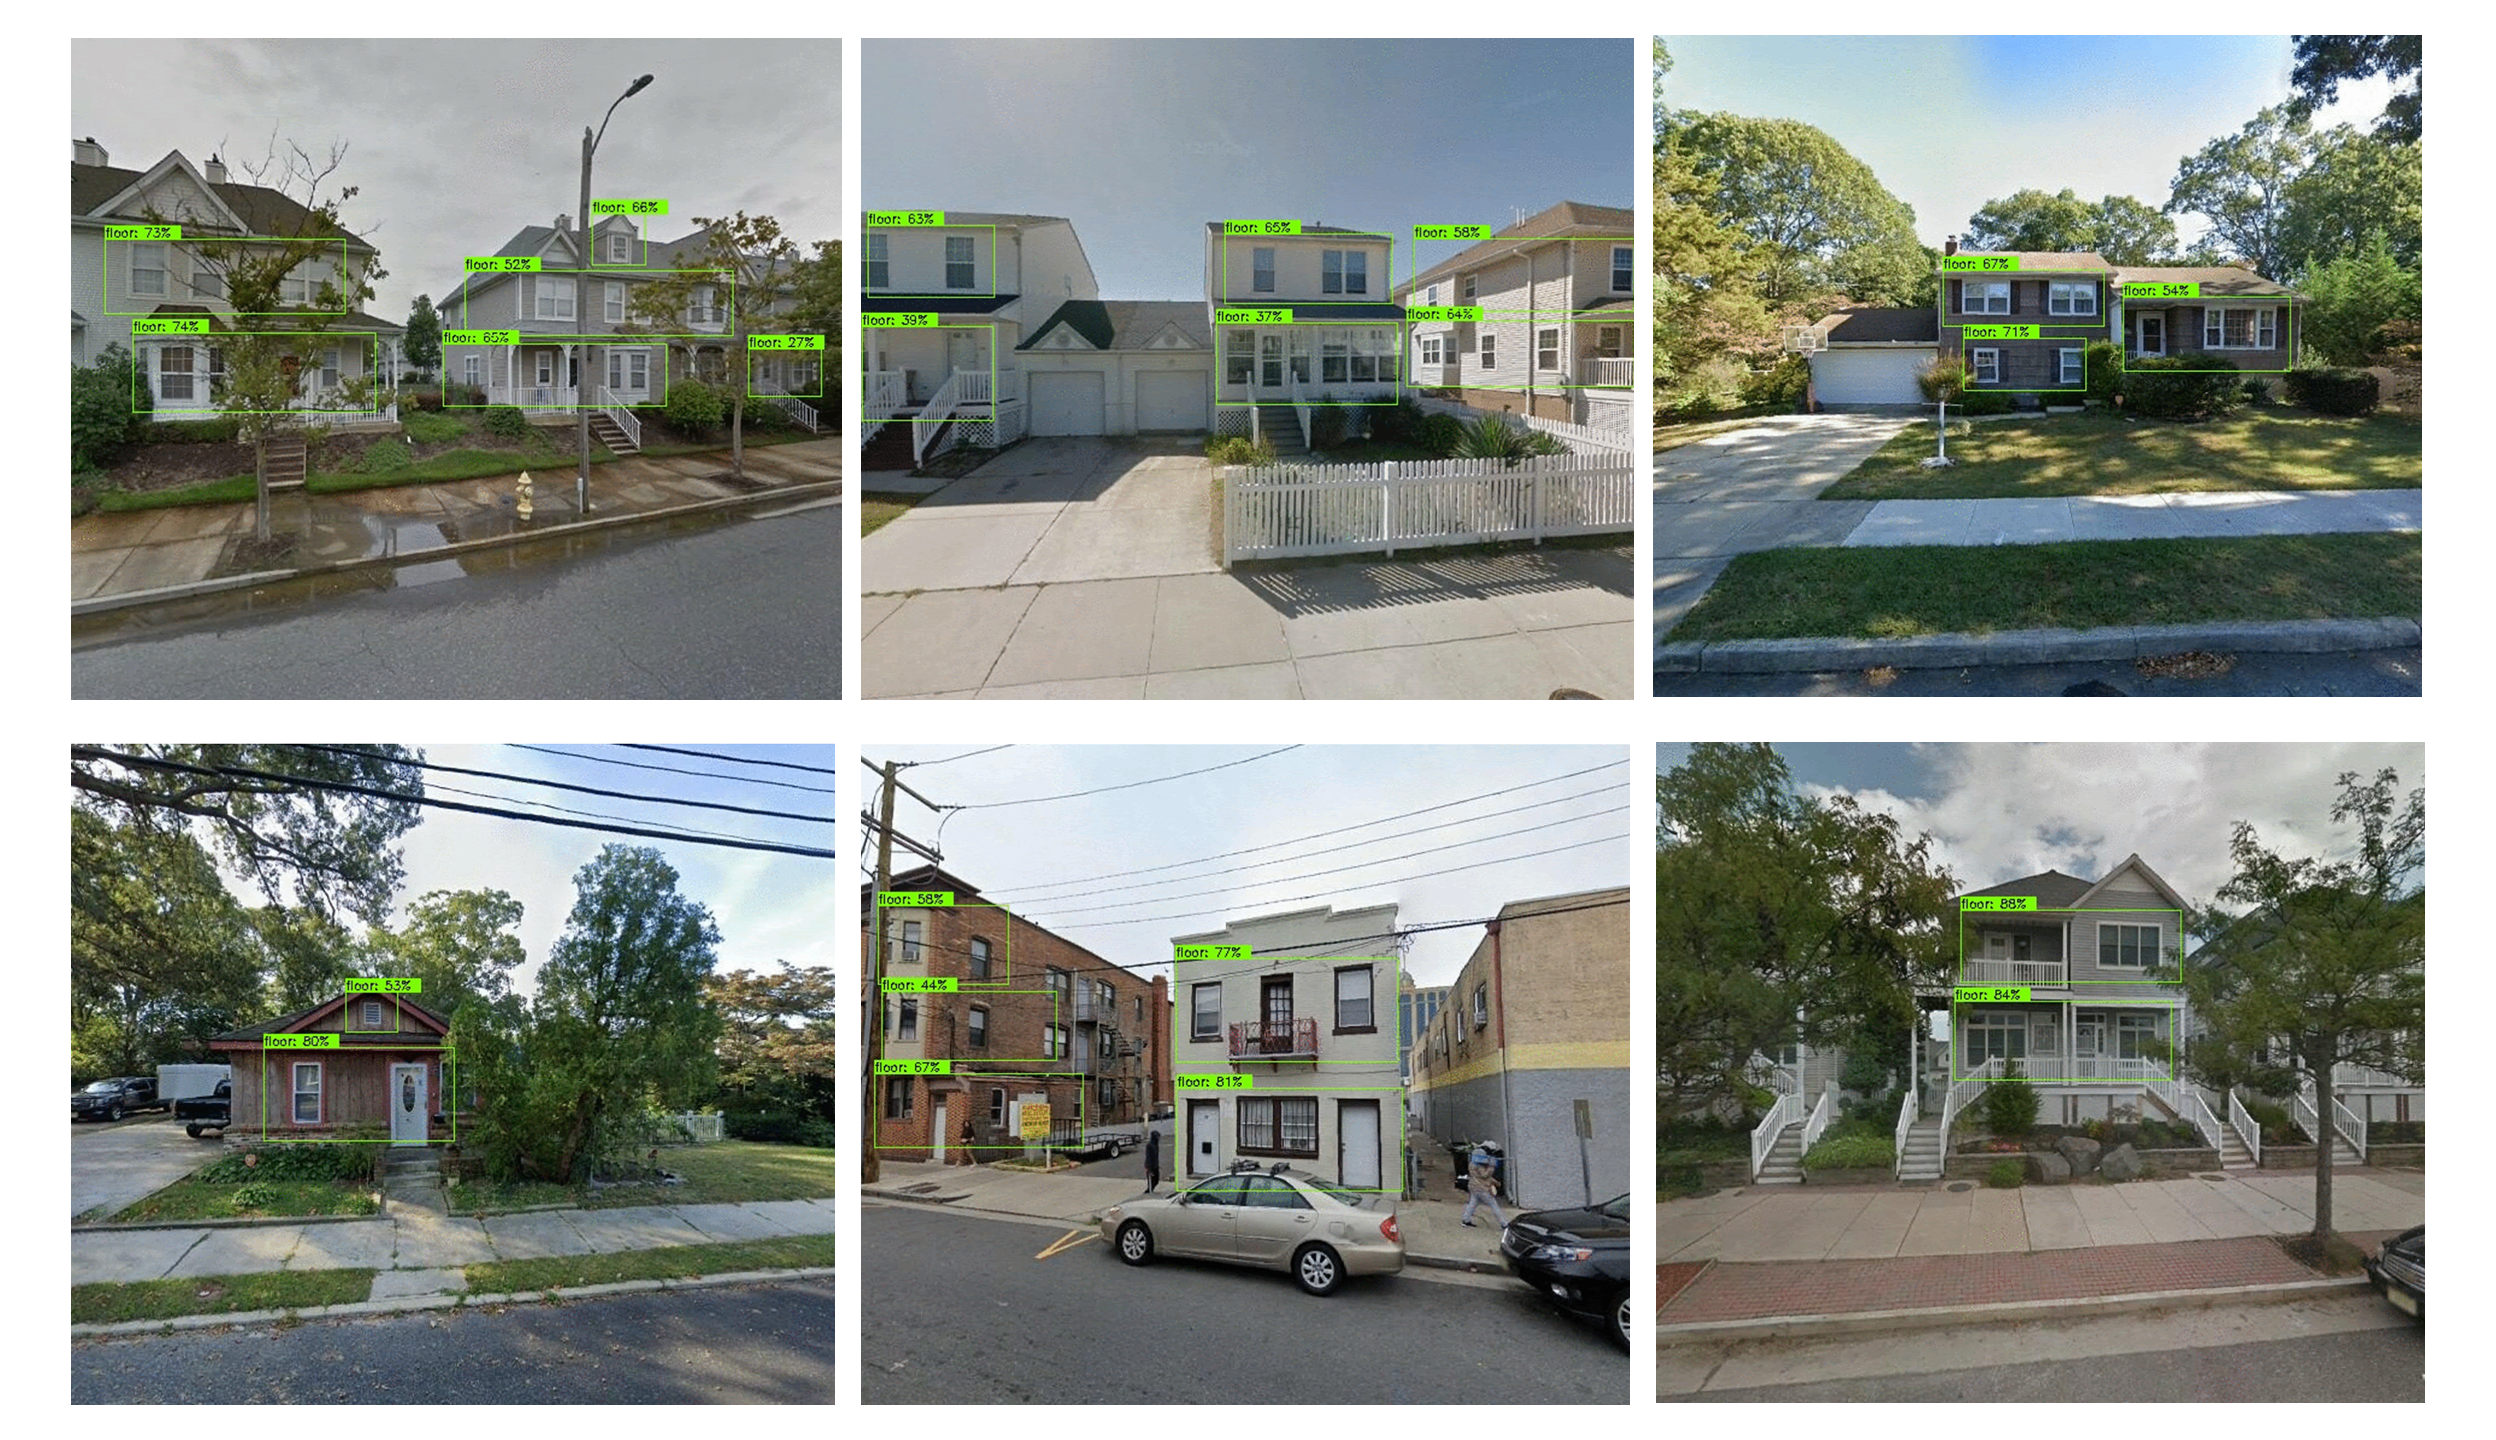
Fig. 2.2.2.1 Sample floor detections of the floor detection model (each detection is indicated by a green bounding box). The percentage value shown on the top right corner of a bounding box indicates the model confidence level associated with that prediction.
For an image, the described floor detection model generates the bounding box output for its detections and calculates the confidence level associated with each detection (see Fig. 2.2.2.1). A post-processor that converts stacks of neighboring bounding boxes into floor counts was developed to convert this output into floor counts. Recognizing that an image may contain multiple buildings at a time, this post-processor was designed to perform counts at the individual building level.
For a random image dataset of buildings captured using arbitrary camera orientations (also termed in the wild images), the developed floor detection model was determined to capture the number of floors information of buildings with an accuracy of 86%. Fig. 2.2.2.2 (a) provides a breakdown of this accuracy measure for different prediction classes (i.e., the confusion matrix of model classifications). It was also observed that if the image dataset is established such that building images are captured with minimal obstructions, the building is at the center of the image, and perspective distortions are limited, the number of floors detections were performed at an accuracy level of 94.7% by the model. Fig. 2.2.2.2 (b) shows the confusion matrix for the model predicting on the “cleaned” image data. In quantifying both accuracy levels, a test set of 3,000 images randomly selected across all counties of a companion testbed in New Jersey, excluding Atlantic County (the site of that testbed), was utilized.
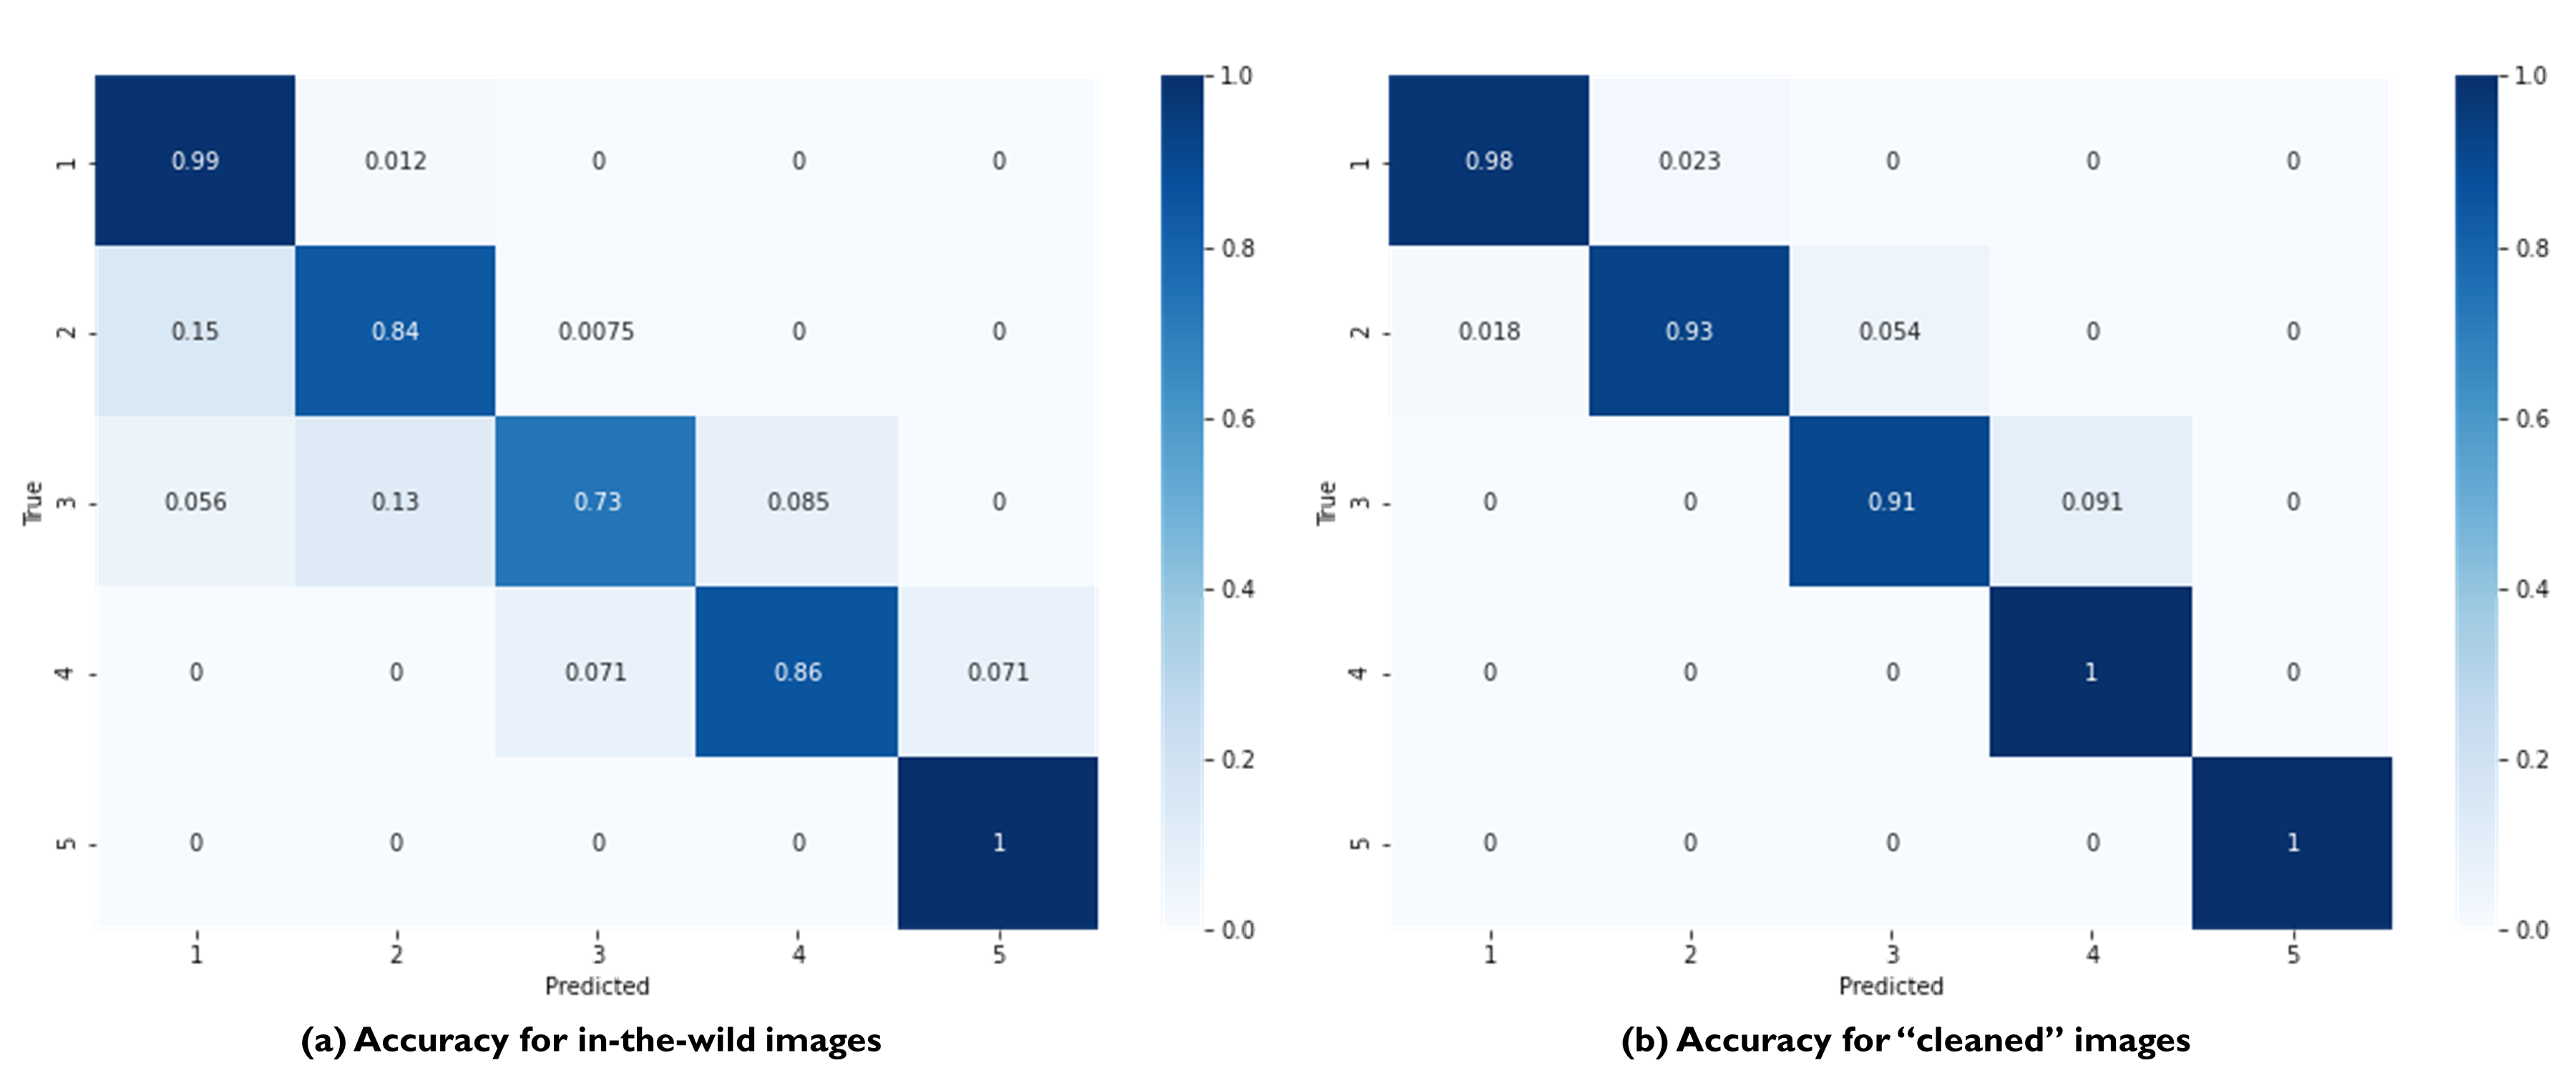
Fig. 2.2.2.2 Confusion matrices for the number of floors predictor used in this study.
Attribute: MeanRoofHt
The elevation of the bottom plane of the roof (lowest edge of roofline) and the elevation of the roof (peak of gable or apex of hip) are estimated with respect to grade (in feet) from street-level imagery. These geometric properties are defined visually for common residential coastal typologies in Fig. 2.2.2.3. The mean height of the roof system is then derived as the average of these dimensions.
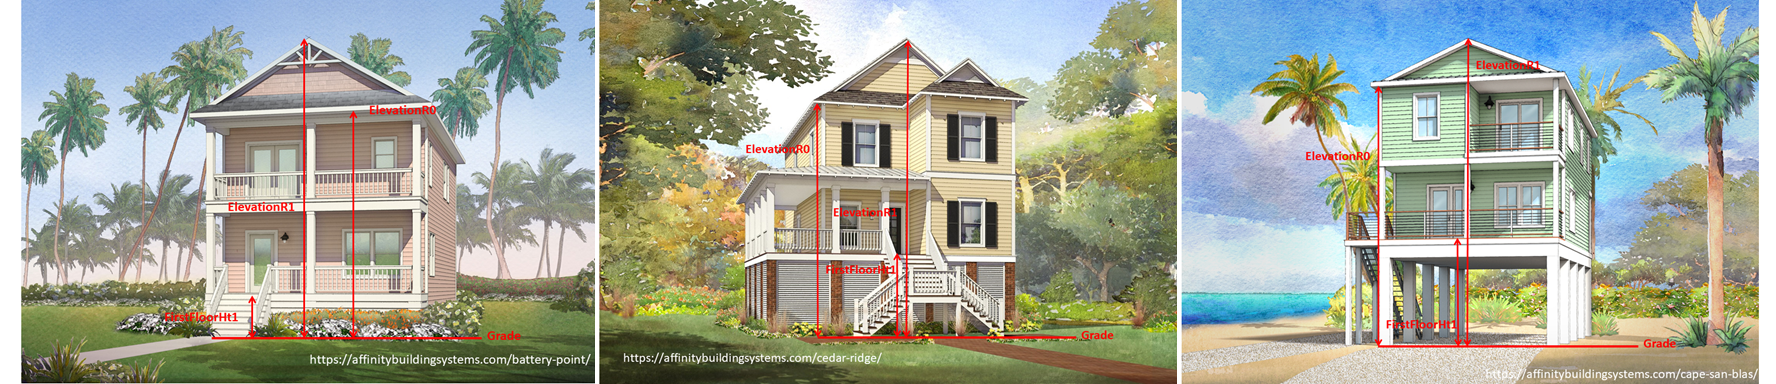
Fig. 2.2.2.3 Schematics demonstrating elevation quantities for different foundation systems common in coastal areas.
The MeanRoofHt is based on the following AI technique. Fig. 2.2.2.4 plots the predicted roof height versus the number of floors of the inventory.
As in any single-image metrology application, extracting the building elevations from imagery requires:
Rectification of image perspective distortions, typically introduced during the capturing of an image.
Determining the pixel counts representing the distances between ends of the objects or surfaces of interest (e.g., for first-floor height, the orthogonal distance between the ground and first-floor levels).
Converting these pixel counts to real-world dimensions by matching a reference measurement with the corresponding pixel count.
Given that the number of street-level images available for a building can be limited and sparsely spaced, a single image rectification approach was deemed most applicable for regional-scale inventory development. The first step in image rectification requires detecting line segments on the front face of the building. This is performed by using the L-CNN end-to-end wireframe parsing method. Once the segments are detected, vertical and horizontal lines on the front face of the building are automatically detected using RANSAC line fitting based on the assumptions that line segments on this face are the predominant source of line segments in the image and the orientation of these line segments change linearly with their horizontal or vertical position depending on their predominant orientation. Another support vector model implemented for image rectification focuses on the street-facing plane of the building in an image, and, based on the Manhattan World assumption, (i.e., all surfaces in the world are aligned with two horizontal and one vertical dominant directions) iteratively transforms the image such that horizontal edges on the facade plane lie parallel to each other, and its vertical edges are orthogonal to the horizontal edges.
In order to automate the process of obtaining the pixel counts for the ground elevations, a facade segmentation model was trained to automatically label ground, facade, door, window, and roof pixels in an image. The segmentation model was trained using DeepLabV3 architecture on a ResNet-101 backbone, pretrained on PASCAL VOC 2012 segmentation dataset, using a facade segmentation dataset of 30,000 images supplemented with relevant portions of the ADE20K segmentation dataset. The peak model performance was attained using the Adam optimizer at a learning rate of 0.001 (batch size: 4), after 40 epochs. The conversion between pixel dimensions and real-world dimensions was attained by the use of field of view and camera distance information collected for each street-level imagery.
Fig. 2.2.2.4 shows a scatter plot of the AI-predicted mean roof heights vs. AI-predicted number of floors. A general trend observed in this plot is that the roof height increases with the number of floors, which is in line with general intuition.
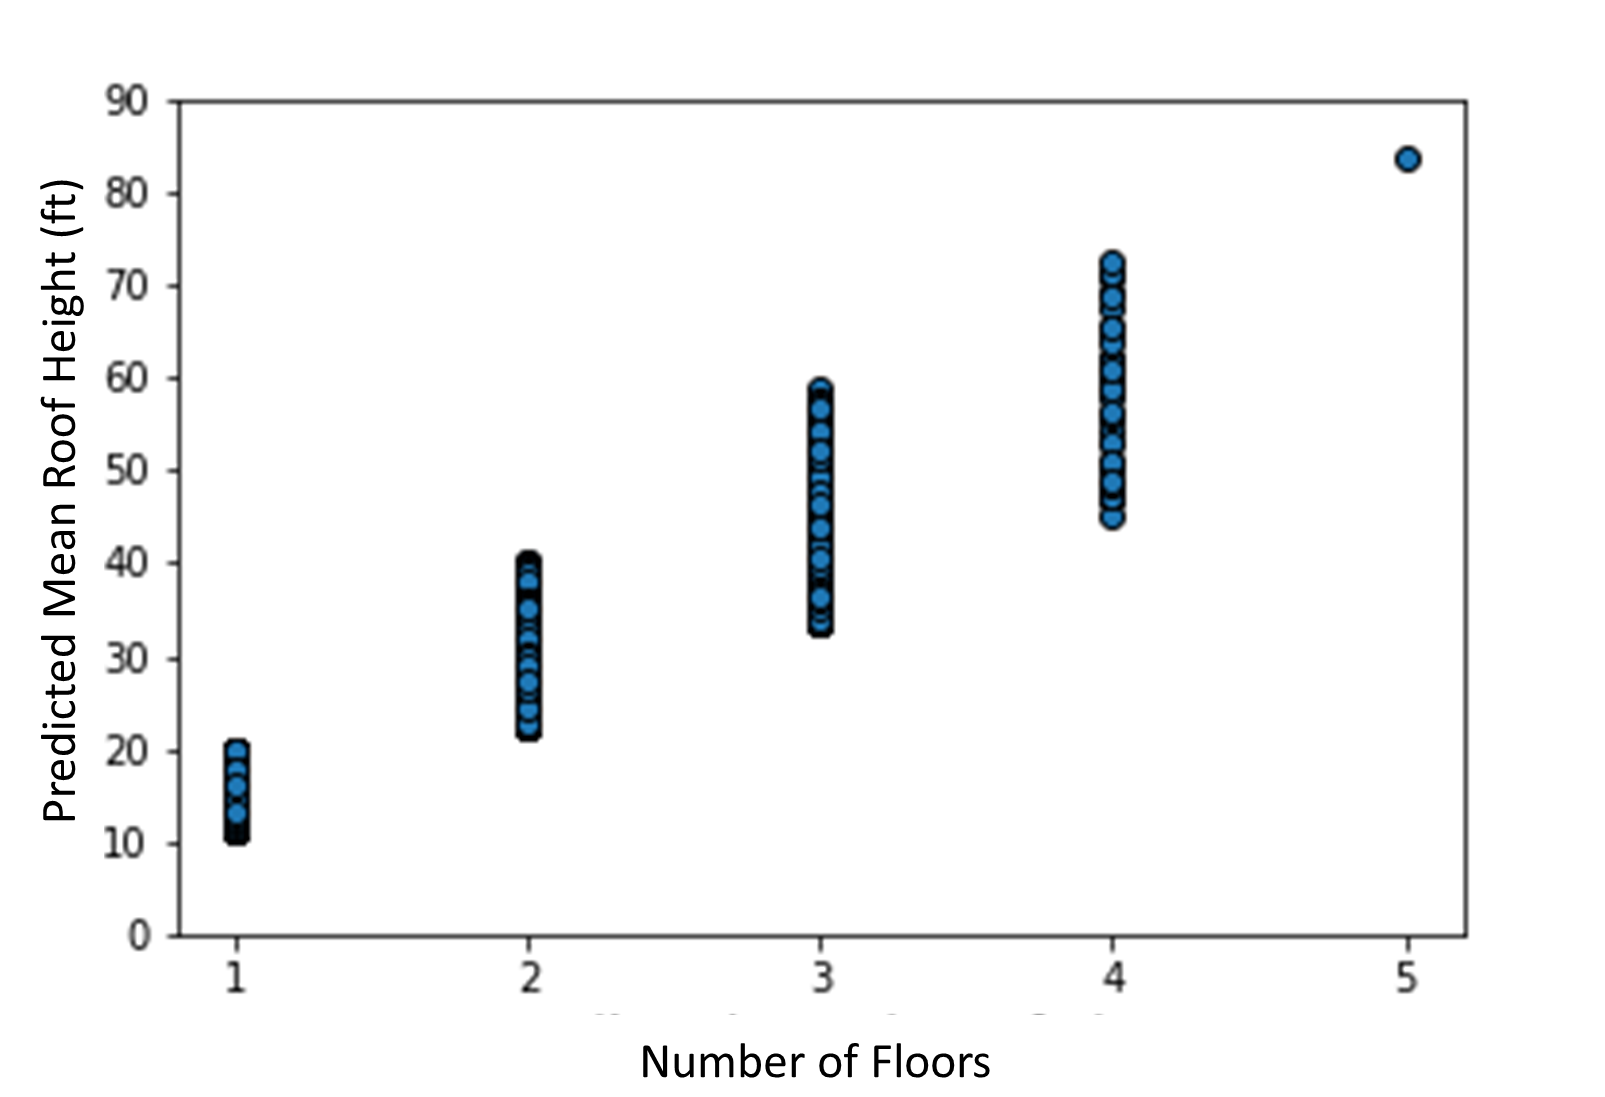
Fig. 2.2.2.4 AI-predicted MeanRoofHt versus number of floors.
Attribute: FirstFloorElevation
FirstFloorElevation is calculated using the distance between the bottom of the facade mask and the bottom of the front door of the building. The process of obtaining these masks follows the same approach used for calculating the mean roof height and is not repeated here.
Attribute: RoofSlope
RoofSlope is calculated as the ratio between the roof height and the roof run. Roof height is obtained by determining the difference between the bottom plane and apex elevations of the roof as defined in the Attribute: MeanRoofHt section. Roof run is determined as half the smaller dimension of the building, as determined from the dimensions of the building footprint. Fig. 2.2.2.5 displays the AI-predicted mean roof height versus the AI-predicted roof pitch ratios. As expected, very little correlation between these two parameters is observed.
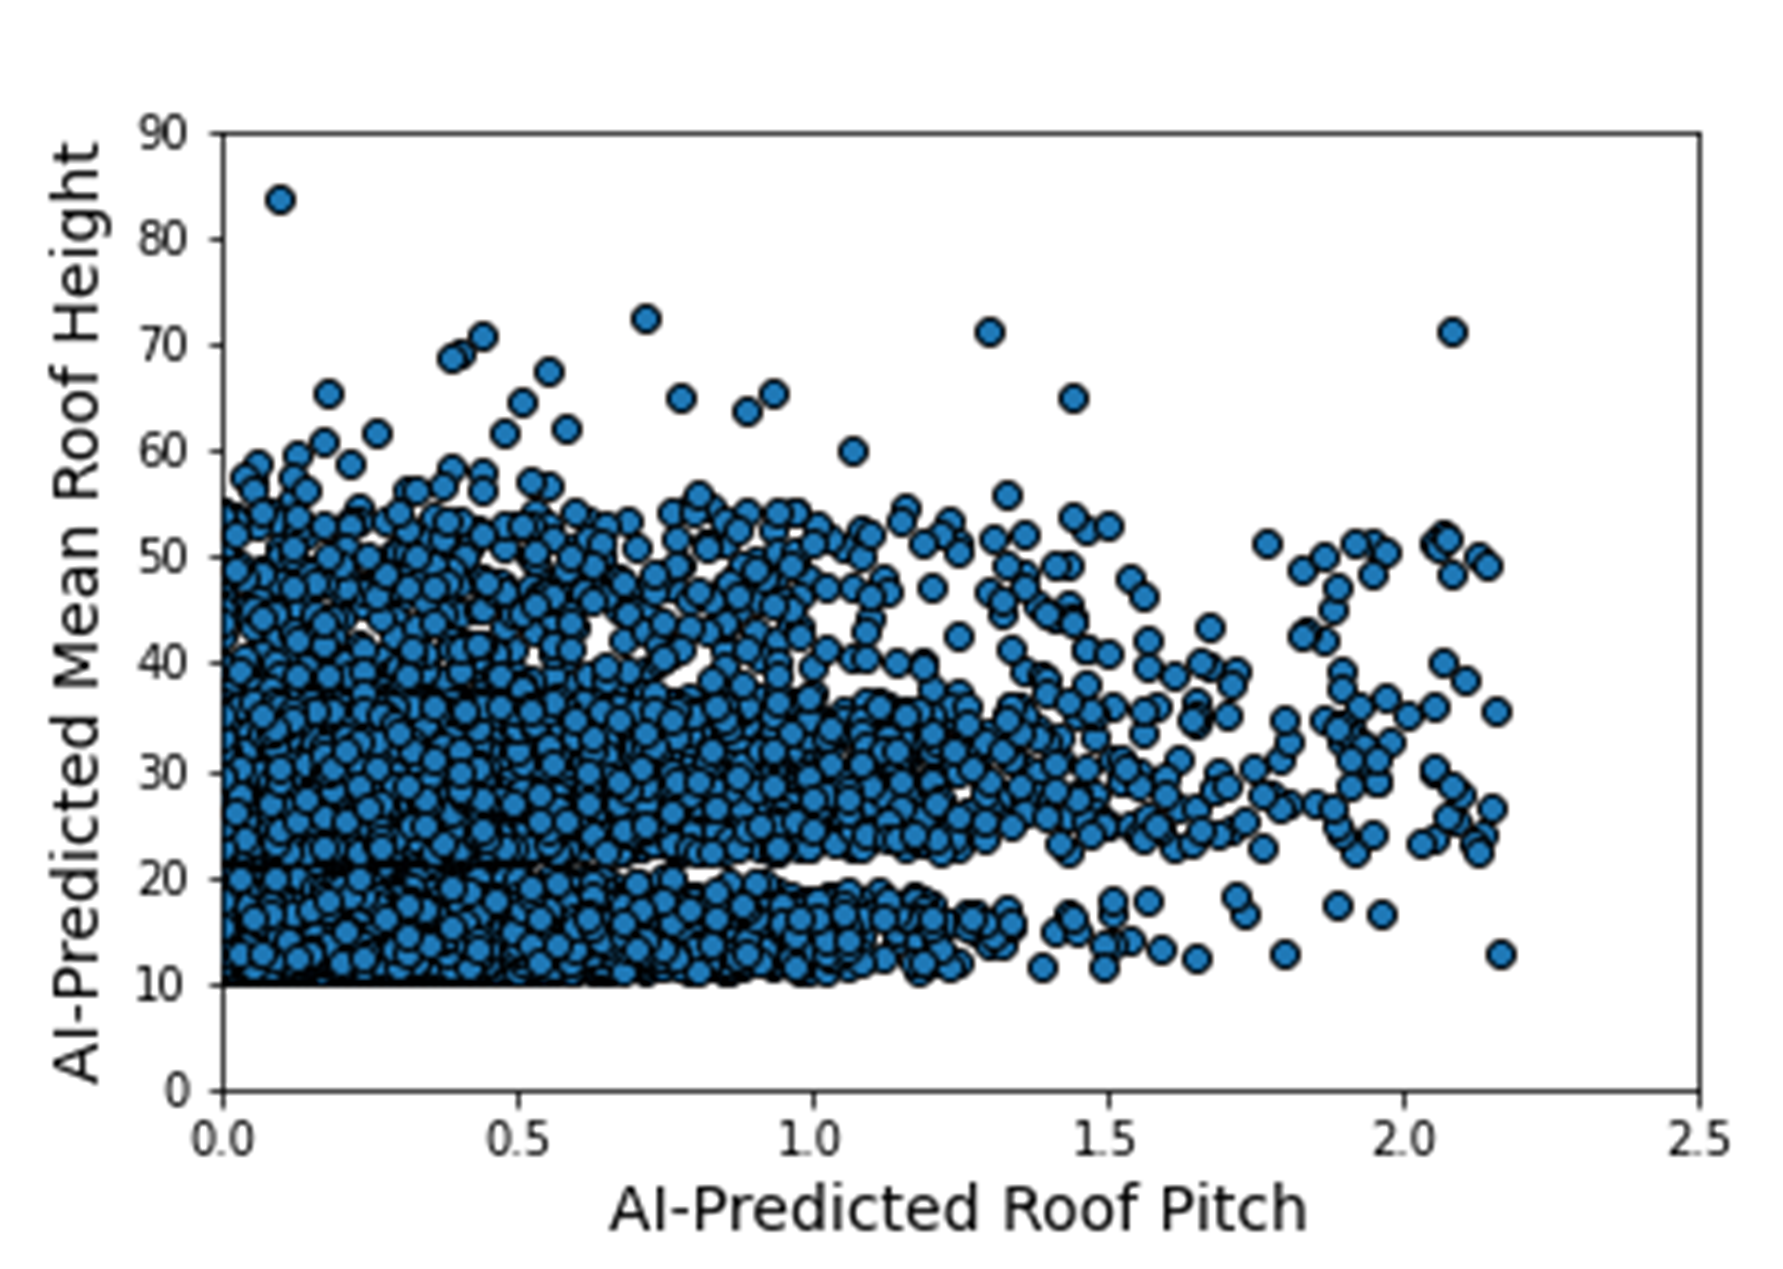
Fig. 2.2.2.5 AI-predicted RoofSlope versus mean roof height.
Attribute: RoofShape
The RoofShape is obtained by CityBuilder using the BRAILS Roof shape module. The roof shape module determines roof shape based on a satellite image obtained for the building. The module uses machine learning, specifically, it utilizes a convolutional neural network that has been trained on satellite images. In AI/ML terminology, the Roof Shape module is an image classifier: it takes an image and classifies it into one of three categories used in HAZUS: gable, hip, or flat as shown in Fig. 2.2.2.6. The original training of the AI model utilized 6,000 images obtained from Google satellite imagery in conjunction with roof labels obtained from Open Street Maps. As many roofs have more complex shapes, a similitude measure is used to determine which of these roof geometries is the best match to a given roof. More details of the classifier can be found here. The trained classifier was employed here to classify the roof information for Atlantic County.
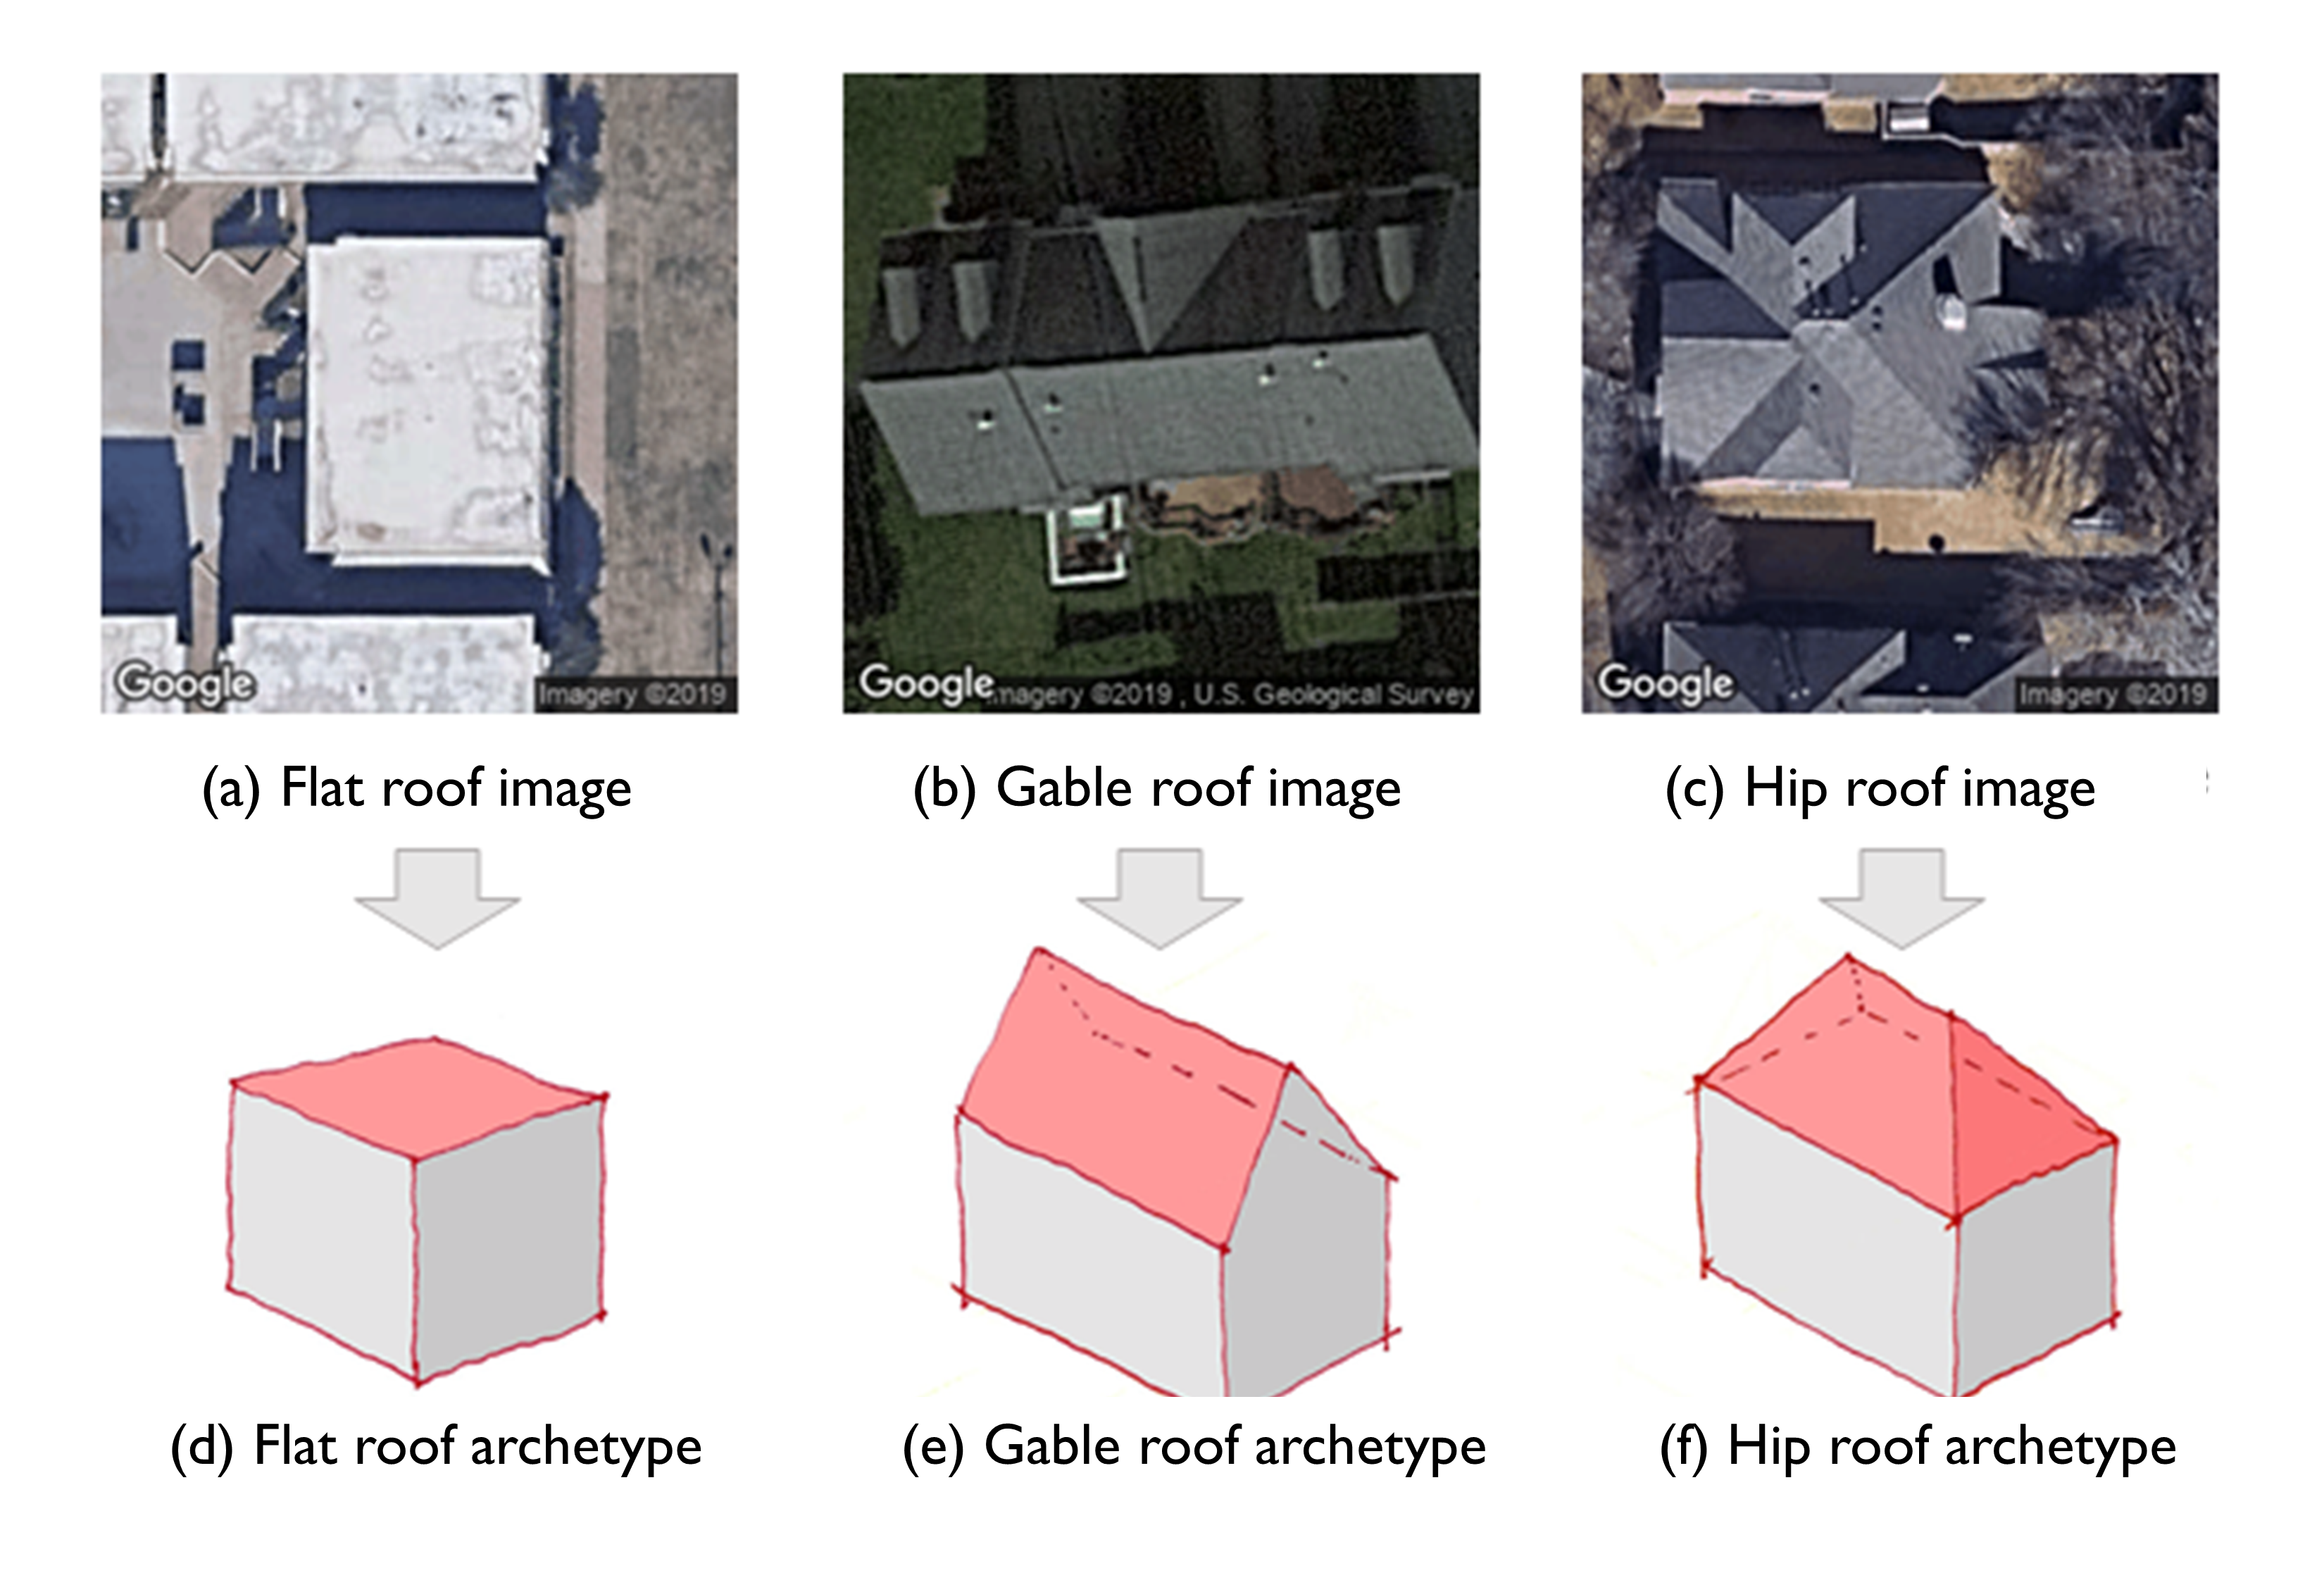
Fig. 2.2.2.6 Roof type classification with examples of aerial images (a-f) and simplified archetypes (d-f) used by Hazus.
The performance of the roof shape classifier was validated against two ground truth datasets. The first is comprised of 125 manually labeled satellite images sampled from OpenStreetMap from across the US, retaining only those with unobstructed views of building roofs (a cleaned dataset). The second is 56 residences assessed by StEER for which roof types were one of the three HAZUS classes, e.g., removing all roofs labeled as “Complex” according to StEER’s distinct image labeling standards. The validation process is documented here. The confusion matrices are presented in Fig. 2.2.2.7. These matrices visually present the comparison between the predictions and actual data and should have values of 1.0 along the diagonal if the classification is perfect, affirming the accuracy of the classification by the roof shape classifier.
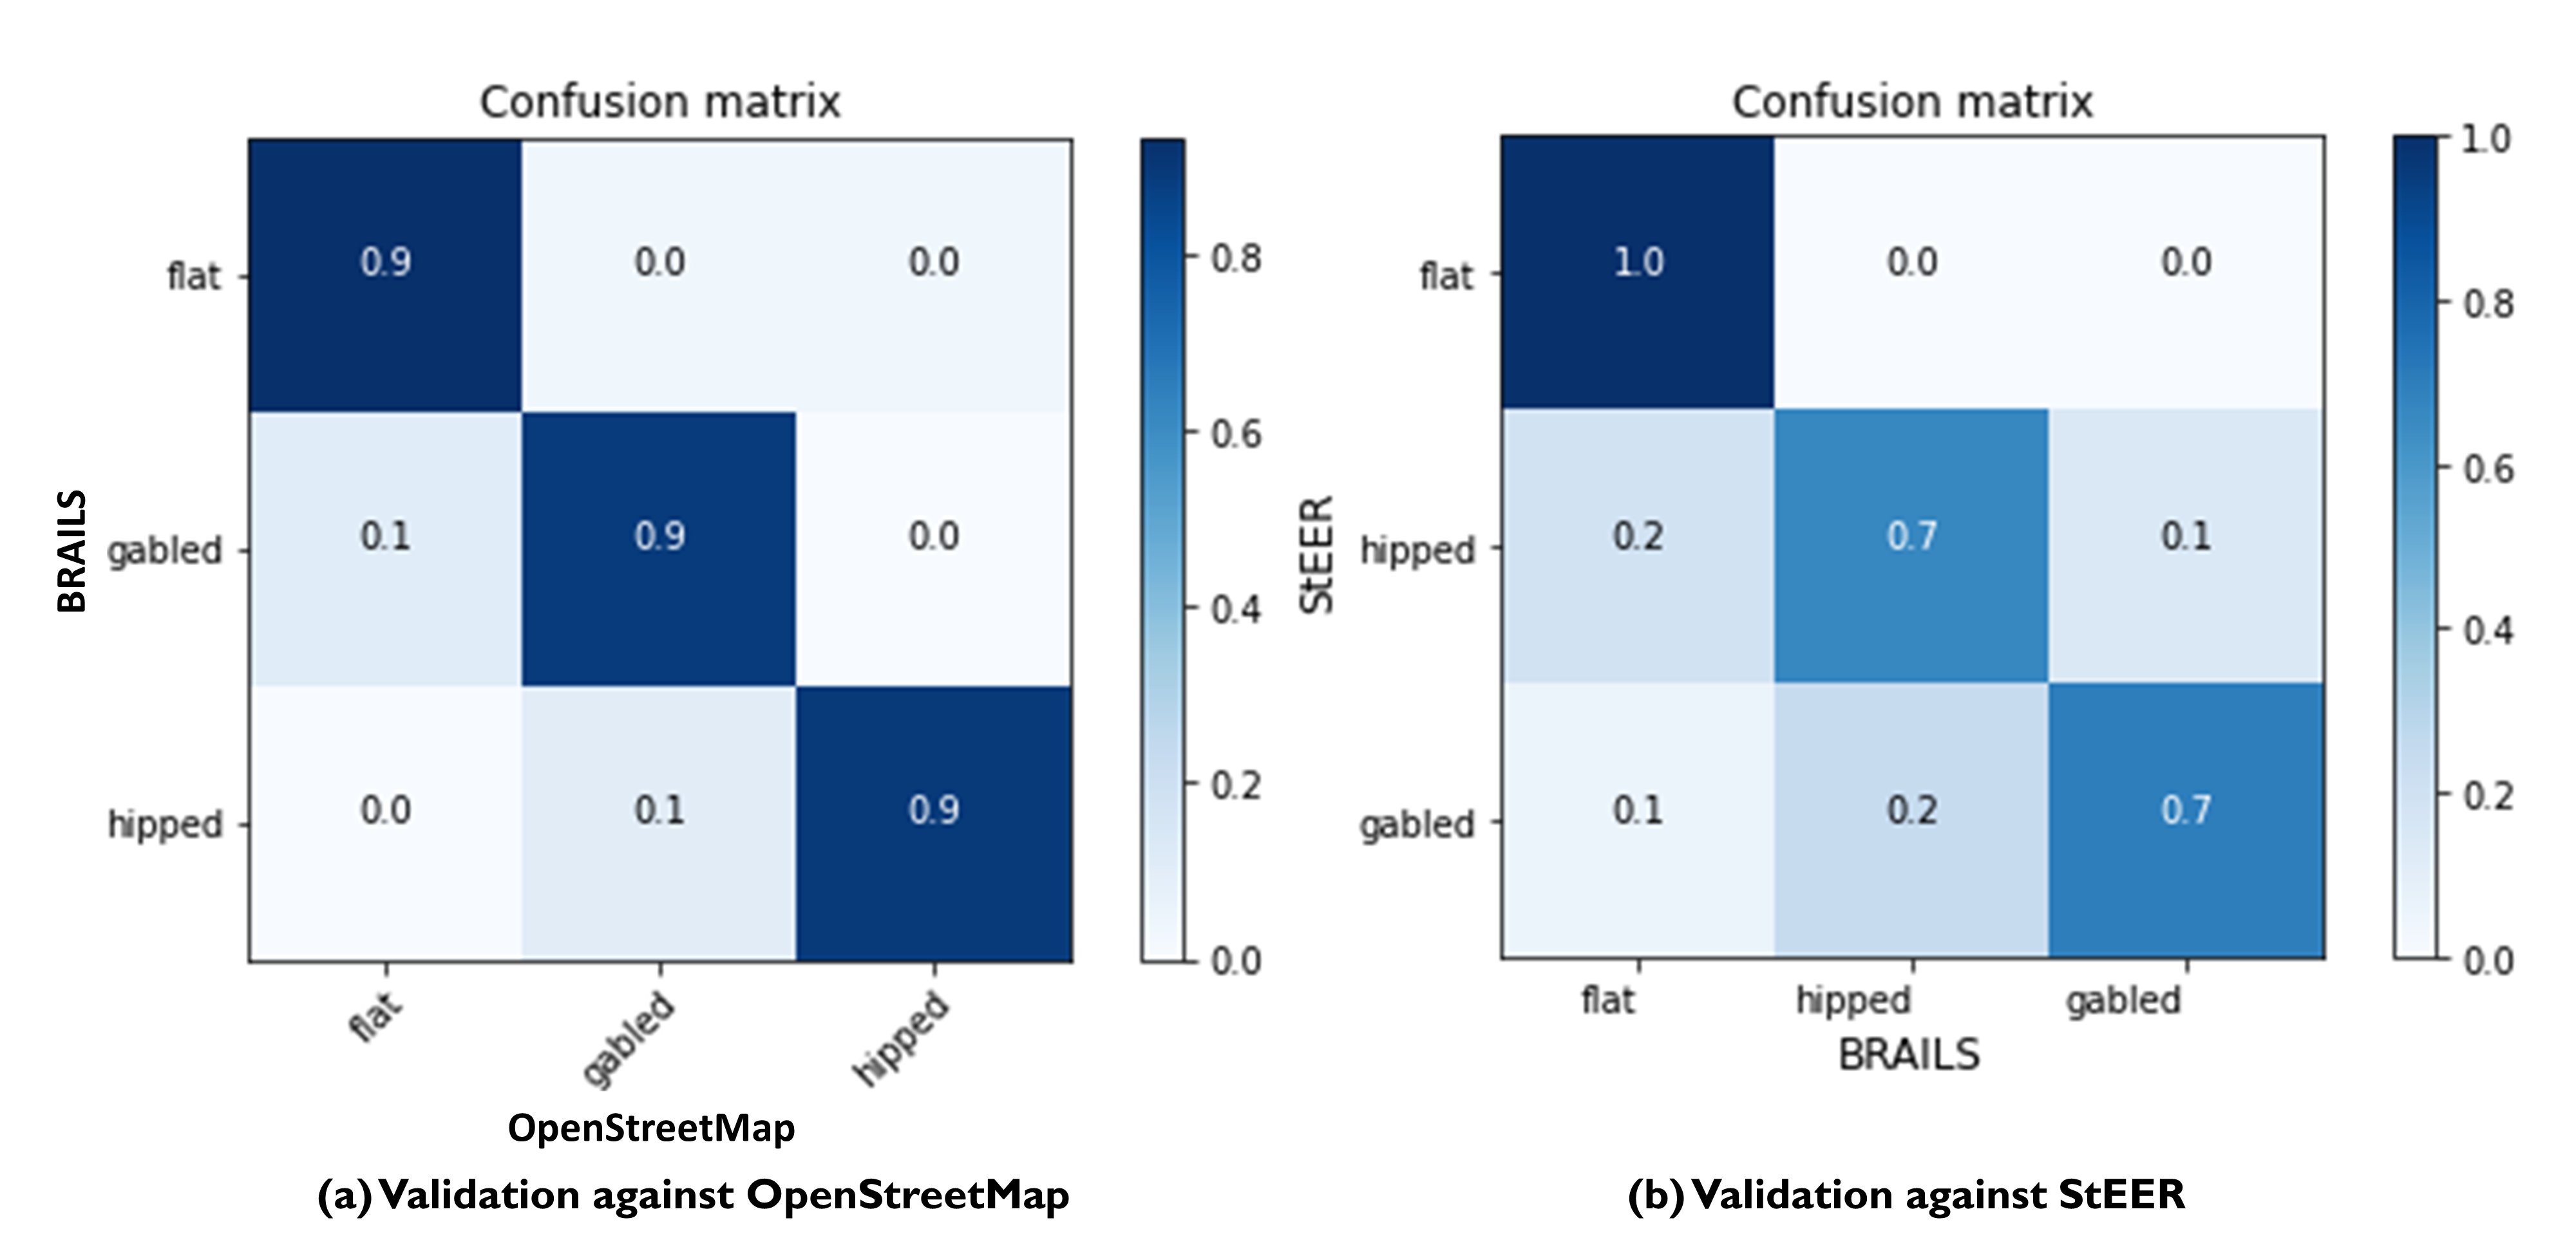
Fig. 2.2.2.7 Validation of BRAILS predicted roof shapes to roof shapes from OpenStreetMap and StEER.
Attribute: WindowArea
The proportion of windows to the overall surface area is not available in inventory and assessor datasets, though it is required for wind loss modeling. Generally, window area can be assumed based on the building occupancy class, using Department of Energy industry databases. This property can also be estimated from street-level imagery by utilizing the window masks generated during the segmentation process when determining building elevations. For this application, window area is defined as a percentage of the total facade area, calculated as the ratio of the area of window masks to the area of the front facade of the building. The underlying assumption is that the proportion of surface area occupied by windows at the front of the building is representative of the amount of window openings on the sides and rear of the building. This allows the ratio calculated for the front face of the building to be applied to the whole building. This assumption may hold for single-family residential buildings, but possibly not for commercial construction where street fronts have higher proportions of glass. Instead of this computer vision approach, users may choose to adopt industry norms for their window areas (see note below).
Note
Industry Norms on Window Area: Engineered residential buildings can be assumed to have low window-to-wall area ratios (WWR) based on the information for Reference Buildings in Baltimore, MD from the Office of Energy Efficiency and Renewable Energy. Reference Buildings were created for select cities based on climate profile; of the available cities, Baltimore is selected since its climate is most similar to Atlantic City, NJ. Office buildings (used as a test case for commercial) have WWR of 33%, and apartments (used as a test case for residential) have WWR of 15%.
Note
The process of constructing the Atlantic County Inventory for footprints beyond those in the Flood-Exposed Inventory highlighted a number of tasks/issues that are commonly encountered when constructing an inventory in a location with sparse inventory data. Recommended best practices are summarized in Best Practices.
2.2.3. Phase III: Augmentation Using Third-Party Data
Attributes were parsed from third-party data providers to populate all required attributes in the Building Inventory data model. For the Flood-Exposed Inventory, NJDEP had already enriched these footprints with various attributes necessary to conduct standard FEMA risk assessments. Specifically, all footprints included a set of Basic Attributes (Table 2.2.3.1). A subset of the data, including Atlantic County, had additional Advanced Attributes required by HAZUS User Defined Facilities (UDF) Module (Table 2.2.3.2) and FEMA Substantial Damage Estimator (SDE) Tool (Table 2.2.3.3).
Field |
Description |
|---|---|
BldgUniqueID |
Building unique ID. The first four characters will be followed by a 9-digit zero-padded number. |
ParcelID |
ParcelID from MOD-IV. |
LAG |
Lowest Adjacent Grade. |
HAG |
Highest Adjacent Grade. |
AreaSqFt |
Area square feet. |
PamsPIN |
MunicipalityCode_Block_Lot_Qual. |
CentroidX |
X coordinate in State Plane Feet. |
CentroidY |
Y coordinate in State Plane Feet. |
DemoYear |
Year demolished. |
BldgNum |
Unique ID for multiple structures in one lot (PAMS_PIN). |
BldgType |
Tag with domain name (i.e., Apartment, Condo). |
Elevation |
Numeric value. |
ElevUnits |
Units of elevation (i.e., feet). |
County |
County name |
Field |
Description |
|---|---|
BldgUniqueID |
Building unique ID. The first four characters will be followed by a 9-digit zero-padded number. |
Name |
Typically assessor attribute for owner. |
Address |
Typically assessor field for property location. |
City |
Typically assessor field for property location city. |
State |
Typically assessor field for property location - state abbreviation. |
ZipCode |
Typically assessor field for property location Zip Code. |
Contact |
Typically assessor attribute for owner. |
Tract |
Value for Census Tract or an area roughly equal to a neighborhood established by the Census Bureau. |
PhoneNumber |
Typically assessor attribute for owner. |
OccupancyClass |
Residential, Commercial, Industrial, Agriculture, Government, Education, and Religious/Non-Profit. |
BuildingType |
Core construction material type; Wood, Concrete, Steel, Masonry, Manufactured Housing. |
Cost |
Replacement value; assessor data does not often include replacement cost. It is usually derived by considering heated or livable space and multiplied by cost per square foot. |
YearBuilt |
Typically assessor attribute. |
Area |
Heated or livable space. May or may not exist in typically assessor attributes. Can potentially be derived from building footprints. |
NumberofStories |
Typically assessor attribute. Indicates number of stories. |
DesignLevel |
Must have the year built to establish; see Hazus Flood Model User Manual, Table 6.2. |
FoundationType |
Flood model needs to distinguish which of seven types. |
FirstFloorHt |
Flood model needs height (in feet) above grade. Can be based on default values assigned to foundation types or other preferred methods. |
ContentCost |
Can be calculated from formula to be applied to final cost per Hazus Flood Model User Manual. |
BldgDmgFnID |
The damage function ID from Hazus would be entered in this field if anything other than the default was to be used. The damage function is based on the building characteristics defined in the items above. |
ContDmgFnID |
The damage function ID from Hazus would be entered in this field if anything other than the default was to be used. The damage function is based on the building characteristics defined in the items above. |
InvDmgFnID |
The damage function ID from Hazus would be entered in this field if anything other than the default was to be used. The damage function is based on the building characteristics defined in the items above. |
FloodProtection |
Does protection exist, and if yes to what frequency? (e.g., 100-year). |
ShelterCapacity |
Number of persons that can be sheltered. |
BackupPower |
Does backup power exist? [yes (1) or no (0)] |
Latitude |
Latitude of the Building Centroid (inside polygon). |
Longitude |
Longitude of the Building Centroid (inside polygon). |
Comment |
As needed. |
InventoryCost |
Can be calculated from formula to be applied to final cost per Hazus Flood Model User Manual. |
RiverineCoastal |
Can be used to identify if building is in riverine or coastal areas. Can be used to help designate the Damage Function IDs. |
HzSourceCit |
Source Citation details. |
Field |
Description |
|---|---|
BldgUniqueID |
Building unique ID. The first four characters will be followed by a 9-digit zero-padded number. |
StructureType |
Residential or Non-Residential. |
ResidenceType |
Residential Type Only: Single Family Residence, Town or Row House, Manufactured House. |
StructureUse |
Non-Residential Type Only: Apartments, Commercial Retail, Mini-Warehouse, etc. |
FoundationType |
Residential Type Only: Select from domain. |
SuperStructure |
Residential Type Only: Select from domain. |
ExteriorFinish |
Residential Type Only: Select from domain. |
ElevationLowestFloor |
Typically assessor attribute. |
NFIPCommunityID |
Typically assessor attribute. |
NFIPCommunityName |
Typically assessor attribute. |
YearConstruction |
Typically assessor attribute. |
Story |
Select from domain. |
RoofCovering |
Select from domain. |
HVACSystem |
Select from domain. |
Quality |
Select from domain. |
SDESourceCit |
Source citation details. |
FloodZone |
From FIRM. |
FIRMPanelID |
FIRM Panel number from S_FIRM_PAN |
For the Atlantic County Inventory, any building not included in the NJDEP footprints had attributes encompassed by NJDEP Basic, UDF or SDE fields assigned by parsing New Jersey Tax Assessor Data (referred to as MODIV) ([MODIV]) as defined in the MODIV User Manual ([MODIV18]). This notably affected attributes such as OccupancyClass, BuildingType, and FoundationType, whose rulesets (PDFs and Python scripts) are cross-referenced in Table 2.2.3.4. In all cases where attributes were derived from MODIV data, which can be sparsely populated, default values were initially assigned to ensure that every footprint would have the attributes required to execute the workflow. These default values were selected using engineering judgment to represent the most common/likely attribute expected or conservatively from the perspective of anticipated losses (i.e., picking the more vulnerable attribute option). These initial assignments were then updated if additional data is available in MODIV to make a more accurate attribute assignment.
Ruleset Name |
Ruleset Definition Table |
Python script |
|---|---|---|
Building Type Rulesets |
To be released |
|
Foundation Type Rulesets |
To be released |
|
Occupancy Type Rulesets |
To be released |
Note
Some attributes in the Building Inventory Data Model were not encompassed by NJDEP Basic, UDF, or SDE fields. Thus, remaining attributes in both the Flood-Exposed and Atlantic County Inventories were assigned using data from the following third-party sources: 1. Locations of essential facilities were sourced from the NJ Office of Information Technology (part of NJGIN Open Data [NJGIN20]). 2. ATC Hazards by Location API ([ATC20]) was used to query Design Wind Speeds as defined in ASCE 7. 3. Terrain features (roughness length associated with different exposure classes) were derived from Land Use Land Cover data (part of NJGIN Open Data [NJGIN20]).
See the Transformation and Detail columns in the PDFs listed in Table 2.2.1.1 for specifics of how each attribute was assigned using these various third-party data sources.
2.2.4. Populated Inventories
Executing this four-phase process resulted in the assignment of all required attributes at the asset description stage of the workflow for both the Atlantic County Inventory and the Flood-Exposed Inventory. Table 2.2.4.1 and Table 2.2.4.2 provide respective examples of each of these inventories. The Flood-Exposed Inventory was then used to extract the subset of buildings defining the Exploration Inventory (see example in Table 2.2.4.3). The full inventories can be downloaded here.
Longitude |
Latitude |
Address |
City |
BldgClass |
YearBuilt |
NumberofStories1 |
OccupancyClass |
BuildingType |
-74.52 |
39.39 |
368 UPLAND AVE |
ABSECON CITY |
17 |
1986 |
1 |
RES1 |
3001 |
-74.69 |
39.65 |
368 UPLAND AVE |
ABSECON CITY |
17 |
1986 |
1 |
RES1 |
3001 |
-74.52 |
39.39 |
135 TENTH AVE |
ABSECON CITY |
17 |
1988 |
1 |
RES1 |
3001 |
-74.71 |
39.65 |
135 TENTH AVE |
ABSECON CITY |
17 |
1988 |
1 |
RES1 |
3004 |
-74.52 |
39.39 |
358 UPLAND AVE |
ABSECON CITY |
17 |
1986 |
1 |
REL1 |
3004 |
-74.71 |
39.65 |
358 UPLAND AVE |
ABSECON CITY |
17 |
1986 |
1 |
RES1 |
3001 |
-74.53 |
39.39 |
360 UPLAND AVE |
ABSECON CITY |
17 |
1986 |
1 |
RES1 |
3001 |
-74.78 |
39.64 |
360 UPLAND AVE |
ABSECON CITY |
17 |
1986 |
1 |
RES1 |
3001 |
-74.53 |
39.39 |
362 UPLAND AVE |
ABSECON CITY |
17 |
1986 |
1 |
RES1 |
3001 |
Address |
City |
State |
Latitude |
Longitude |
OccupancyClass |
BuildingType |
UseCode |
BldgClass |
DesignLevel |
YearBuiltNJDEP |
YearBuiltMODIV |
NumberofStories0 |
NumberofStories1 |
NoUnits |
PlanArea0 |
PlanArea1 |
FoundationType |
SplitLevel |
ElevationR0 |
ElevationR1 |
FirstFloorHt0 |
FirstFloorHt1 |
FloodZone |
DSWII |
WindZone |
AvgJanTemp |
RoofShape |
RoofSlope |
RoofCover |
RoofSystem |
MeanRoofHt |
WindowArea |
Garage |
z0 |
14 W LEE AVE |
Absecon |
NJ |
39.42 |
-74.5 |
RES1 |
3001 |
17 |
NE |
1956 |
1956 |
3101 |
2 |
1 |
1311 |
1311 |
3505 |
NO |
19.64 |
33.89 |
3 |
-2.97 |
6112 |
122 |
I |
Above |
Gable |
0 |
5701 |
26.8 |
0 |
0 |
0.35 |
||
28 W SUMMIT AVE |
Absecon |
NJ |
39.42 |
-74.5 |
RES1 |
3001 |
17 |
NE |
1948 |
1948 |
3101 |
2 |
1 |
1061 |
1061 |
3505 |
NO |
33.52 |
47.46 |
3 |
6.72 |
6112 |
122 |
I |
Above |
Gable |
0 |
5701 |
40.5 |
0 |
0 |
0.35 |
||
6353 MONMOUTH DRIVE |
Hamilton |
NJ |
39.45 |
-74.75 |
RES1 |
3001 |
17 |
NE |
1954 |
1954 |
3101 |
1 |
1 |
1047 |
1047 |
3507 |
NO |
18.92 |
31.75 |
1 |
2.02 |
6112 |
118 |
I |
Above |
Gable |
0 |
5701 |
25.3 |
0 |
0 |
0.35 |
||
2004 SYCAMORE LANE |
Hamilton |
NJ |
39.53 |
-74.79 |
RES1 |
3001 |
17 |
NE |
1977 |
1977 |
3102 |
2 |
1 |
1234 |
1234 |
3507 |
NO |
31.43 |
43.06 |
1 |
1.96 |
6112 |
117 |
I |
Above |
Hip |
0 |
5701 |
37.2 |
0 |
1.1 |
0.35 |
||
35 PENNINGTON AVENUE |
Hamilton |
NJ |
39.45 |
-74.73 |
RES1 |
3001 |
17 |
NE |
1924 |
1924 |
3103 |
2 |
1 |
936 |
936 |
3505 |
NO |
34.55 |
47.39 |
3 |
6.76 |
6112 |
119 |
I |
Above |
Gable |
0 |
5701 |
41 |
0 |
0 |
0.35 |
||
135 GARNETT LANE |
Egg Harbor |
NJ |
39.38 |
-74.59 |
RES1 |
3001 |
16 |
NE |
2005 |
2005 |
3102 |
2 |
1 |
2579 |
2579 |
3507 |
NO |
29 |
37.43 |
1 |
2.6 |
6112 |
121 |
I |
Above |
Gable |
0 |
5701 |
33.2 |
0 |
0 |
0.35 |
||
122 GARNETT LANE |
Egg Harbor |
NJ |
39.38 |
-74.59 |
RES1 |
3001 |
16 |
NE |
2005 |
2005 |
3102 |
2 |
1 |
2441 |
2441 |
3507 |
NO |
27.38 |
33.19 |
1 |
0.27 |
6112 |
121 |
I |
Above |
Hip |
0 |
5701 |
30.3 |
0 |
0 |
0.35 |
||
332 MONTCLAIR DR |
Pleasantville |
NJ |
39.41 |
-74.5 |
RES3C |
3001 |
16 |
E |
1954 |
1954 |
3303 |
1 |
1 |
1602 |
1602 |
3507 |
NO |
16.67 |
24.08 |
1 |
0.87 |
6112 |
122 |
I |
Above |
Gable |
0 |
20.4 |
0 |
1.1 |
0.35 |
|||
128 N FRANKLIN BLVD |
Pleasantville |
NJ |
39.39 |
-74.52 |
RES1 |
3001 |
15 |
NE |
1943 |
1943 |
3101 |
2 |
1 |
1062 |
1062 |
3505 |
NO |
32.89 |
42.43 |
3 |
8.08 |
6112 |
122 |
I |
Above |
Hip |
0 |
5701 |
37.7 |
0 |
0 |
0.35 |
Address |
City |
State |
Latitude |
Longitude |
OccupancyClass |
BuildingType |
UseCode |
BldgClass |
DesignLevel |
YearBuiltNJDEP |
YearBuiltMODIV |
NumberofStories0 |
NumberofStories1 |
NoUnits |
PlanArea0 |
PlanArea1 |
FoundationType |
SplitLevel |
ElevationR0 |
ElevationR1 |
FirstFloorHt0 |
FirstFloorHt1 |
FloodZone |
DSWII |
WindZone |
AvgJanTemp |
RoofShape |
RoofSlope |
RoofCover |
RoofSystem |
MeanRoofHt |
WindowArea |
Garage |
z0 |
425 N MARYLAND AVE |
Atlantic City |
NJ |
39.37 |
-74.43 |
RES1 |
3001 |
210 |
NaN |
NE |
1969 |
0 |
3102 |
1 |
1 |
906.2940373 |
906.2940373 |
3505 |
NO |
12.09 |
25.16 |
3 |
-0.83 |
6106 |
124 |
I |
Above |
Flat |
0 |
5701 |
Wood |
18.6 |
0 |
0 |
0.03 |
125 N FLORIDA AVE |
Atlantic City |
NJ |
39.36 |
-74.44 |
RES3B |
3001 |
NaN |
ME |
1969 |
0 |
3301 |
2 |
1 |
746.77695 |
746.77695 |
3505 |
NO |
20.8 |
28.38 |
3 |
-1.12 |
6106 |
124 |
I |
Above |
Flat |
0 |
NaN |
Wood |
24.6 |
0 |
0 |
0.03 |
|
600 HURON AVE |
Atlantic City |
NJ |
39.38 |
-74.43 |
GOV2 |
3001 |
NaN |
E |
1969 |
0 |
3401 |
3 |
1 |
1513.12497 |
1513.12497 |
3507 |
NO |
53.51 |
64.92 |
1 |
2.61 |
6102 |
124 |
I |
Above |
Hip |
0 |
NaN |
Wood |
59.2 |
0 |
0 |
0.03 |
|
332 N RHODE ISLAND AVE |
Atlantic City |
NJ |
39.37 |
-74.42 |
IND1 |
3003 |
100 |
NaN |
E |
1969 |
0 |
3401 |
1 |
1 |
1000.334181 |
1000.334181 |
3507 |
NO |
12.94 |
25.08 |
1 |
0.65 |
6106 |
124 |
I |
Above |
Flat |
0 |
NaN |
Wood |
19 |
0 |
0 |
0.03 |
1 ATLANTIC OCEAN |
Atlantic City |
NJ |
39.35 |
-74.43 |
COM8 |
3003 |
738 |
NaN |
ME |
1969 |
0 |
3401 |
1 |
1 |
177963.6629 |
177963.6629 |
3502 |
NO |
23.82 |
31.38 |
5 |
9.26 |
6102 |
124 |
I |
Above |
Flat |
0 |
NaN |
Wood |
27.6 |
0 |
0 |
0.03 |
11 N MORRIS AVE |
Atlantic City |
NJ |
39.35 |
-74.45 |
RES3B |
3001 |
45 |
ME |
1900 |
1900 |
3301 |
2 |
3 |
835.133255 |
835.133255 |
3504 |
NO |
22.28 |
31.19 |
-4 |
0 |
6106 |
124 |
I |
Above |
Hip |
0 |
NaN |
Wood |
26.7 |
0 |
0 |
0.03 |
|
601 N ALBANY AVE |
Atlantic City |
NJ |
39.36 |
-74.46 |
COM1 |
3003 |
NaN |
ME |
1969 |
0 |
3401 |
1 |
1 |
654.0515616 |
654.0515616 |
3507 |
NO |
12.92 |
22.85 |
1 |
0.48 |
6106 |
124 |
I |
Above |
Flat |
0 |
NaN |
Wood |
17.9 |
0 |
0 |
0.03 |
|
1500-1538 ADRIATIC AVE |
Atlantic City |
NJ |
39.37 |
-74.43 |
RES3C |
3004 |
NaN |
ME |
1969 |
0 |
3301 |
1 |
1 |
938.5675163 |
938.5675163 |
3505 |
NO |
22.15 |
30.29 |
3 |
8.37 |
6106 |
124 |
I |
Above |
Gable |
0 |
NaN |
Wood |
26.2 |
0 |
0 |
0.03 |
|
900 BEACH THOROFARE |
Atlantic City |
NJ |
39.38 |
-74.42 |
GOV2 |
3001 |
NaN |
E |
1969 |
0 |
3401 |
2 |
1 |
606.967372 |
606.967372 |
3507 |
NO |
36.33 |
45.23 |
1 |
0.84 |
6106 |
124 |
I |
Above |
Flat |
0 |
NaN |
Wood |
40.8 |
0 |
0 |
0.03 |
Inventory Name |
DesignSafe Document |
Number of Assets |
Typical Run Time |
|---|---|---|---|
Atlantic County Inventory |
100,721 |
~ 1,500 CPU-Hour |
|
Flood-Exposed Inventory |
32,828 |
~ 440 CPU-Hour |
|
Exploration Inventory |
1,000 |
~ 12 CPU-Hour |
- ATC20
ATC (2020b), ATC Hazards By Location, https://hazards.atcouncil.org/, Applied Technology Council, Redwood City, CA.
- NJGIN20(1,2)
NJ Geographic Information Network, State of New Jersey, https://njgin.nj.gov/njgin/#!/
- Wang19
Wang C. (2019), NHERI-SimCenter/SURF: v0.2.0 (Version v0.2.0). Zenodo. http://doi.org/10.5281/zenodo.3463676
- Microsoft2018
Microsoft (2018) US Building Footprints. https://github.com/Microsoft/USBuildingFootprints
- MODIV
Parcels and MOD-IV of Atlantic County, NJ. NJGIN Open Data, https://njogis-newjersey.opendata.arcgis.com/datasets/680b02ff9b4348409a2f4ccd4c238215.
- MODIV18
Department of the Treasury, State of New Jersey (2018), MOD IV User Manual. https://www.state.nj.us/treasury/taxation/pdf/lpt/modIVmanual.pdf