3.1. Overview
This testbed for regional hurricane risk assessment of Lake Charles, LA under wind hazards adopts an approach consistent with that developed for the Atlantic County testbed. Its intent is to (1) explore the possibility of using advanced machine learning and artificial intelligence techniques to populate/predict important building features that are limited by the tax assessor and open inventory data, (2) further validate the developed workflow with a recent hurricane event with field investigation data, and (3) identify potential research needs for refining/upgrading/extending damage assessment methods and models at parcel levels. Similar to the general idea of other testbeds, community developers can progressively contribute refinements that increase the fidelity and capacities of the backend regional resilience assessment workflow. This documentation specifically demonstrates the process of: (1) asset description, (2) hazard characterization, (3) asset representation, (4) damage and loss modeling for the Lake Charles inventory. Sample results are presented to verify the workflow and validate its different aspects against multiple published datasets.
3.1.1. Rationale
As detailed in [Roueche20], Hurricane Laura made landfall as a strong Category 4 storm near Cameron, LA in the early hours of 27 August 2020, tying the Last Island Hurricane of 1856 as the strongest land-falling hurricane in Louisiana history. Wind speeds are estimated to have reached or exceeded the design wind speeds for Risk Category II buildings and other structures, as defined in ASCE 7-16 ([ASCE16]) and the 2018 International Building Code (MRI = 700 years) ([ICC18]), by as much as \(8 km/h\) (\(5 mph\)) near Lake Charles, LA (specifically, northeastern Calcasieu Parish and the eastern half of Beauregard Parish) ([ARA20]). Meanwhile, storm surge resulted in high water marks of over \(5 m\) (\(17 ft\)) above ground in Oak Grove, LA in Cameron Parish ([Pasch21]). These combined hazards resulted in substantial impacts to port and industrial facilities serving the oil and gas sector, widespread damages in the residential sector, and sustained outages of water and power impacting the operation of hospitals providing critical care during a pandemic. Notable damage was reported to commercial facilities, particularly to hotels, including high-rise buildings in Lake Charles associated with casinos and resorts. As the storm’s well-predicted track facilitated coordinated, multi-entity surface measurements of wind fields (surface observation networks and mobile radar) and storm surge, Laura is one of the best documented storm events and thus provides novel opportunities to understand the vulnerabilities underpinning losses across a diversity of building occupancies and other critical infrastructure.
This testbed builds upon existing relationships between SimCenter and the Structural Extreme Events Reconnaissance (StEER) Network, which made various reconnaissance data in the affected region available for initial validation. The validation did not take advantage of the extensive street-level panoramas (available in Google Maps) that can provide an even richer validation dataset for this hurricane. Notably, the areas impacted by Laura were previously impacted by Hurricane Rita (2005), with many structures reconstructed or repaired and unfortunately damaged again. As a large swath of modern (post-IBC/IRC construction) single-family residential structures were impacted by design-level winds during Hurricane Laura, underscoring vulnerabilities to garage doors and high rates of roof cover losses, the current implementation mainly focuses on establishing the residential inventories, though other building classes warrant future investigation, including mobile homes where even Zone II anchorages were observed to fail. Notably, regrettably low rates of impact-resistant fenestration were observed by StEER across the region, further suggesting opportunities to explore this attribute in the ensuing losses.
This testbed also demonstrates the challenges of creating inventories in areas where tax assessor and other open inventory data are limited. Thus, the experience creating this testbed models best practices and strategies for augmenting sparse inventory data in a given region, e.g., semantically describing assets using information inferred by artificial intelligence.
3.1.2. Capabilities & Supported Hazards
The testbed supports the transition from census-block-level loss projections to asset-level projections that assess the damage to individual buildings under hurricane-induced wind hazards. Water penetration due to the breach of building envelopes and/or wind-borne debris impact is also captured in the damage and loss modeling, though the physics of these phenomena themselves are not explicitly modeled. Storm surge, flood, and other rainfall-induced hazards are not included in the current implementation. Moreover, the inventory focuses only on wood-frame residential construction. These intentional focuses of the current implementation leave ample room for further community-led development. The adoption of HAZUS loss estimation frameworks [FEMA18] takes advantage of a process developed in Atlantic County, NJ for assigning attributes to specific building footprints using time-evolving heuristic rulesets grounded in local codes/standards and normative practice. As this testbed demonstrates a quick “spin-up” after a hurricane, the rulesets from New Jersey are directly applied; while many of the practices are common, further refinements of the workflow should revise these rulesets to reflect the phasing of specific regulations and mitigation measures in Lake Charles.
3.1.3. Current Implementation
For the initial implementation of the backend workflow, asset description adopts an augmented parcel, and available hindcast wind fields provide the Peak Wind Speed (PWS) during the hurricane (used as a hazard intensity measure). In lieu of a structural analysis model, assets are assigned attributes associated with various HAZUS-consistent building classifications. The adoption of HAZUS damage and loss assessment methodology for hurricanes thus enables these intensity measures to be related to probabilities of damage and loss, based on the building class and assigned attributes.
3.1.4. Available Inventories
The constructed building inventory developed for Lake Charles is accessible via DesignSafe. Among the total 30,072 collected buildings in the city of Lake Charles, 26,516 are classified as residential buildings, and 3,556 are commercial buildings (classified by BRAILS, more details will be introduced in Asset Description).
This testbed creates and focuses on an inventory of the 26,516 residential buildings. Fig. 3.1.4.1 visualizes the Year Built of the buildings in the inventory. Fig. 3.1.4.2 shows the geospatial distribution
of the occupancy classes in the inventory.
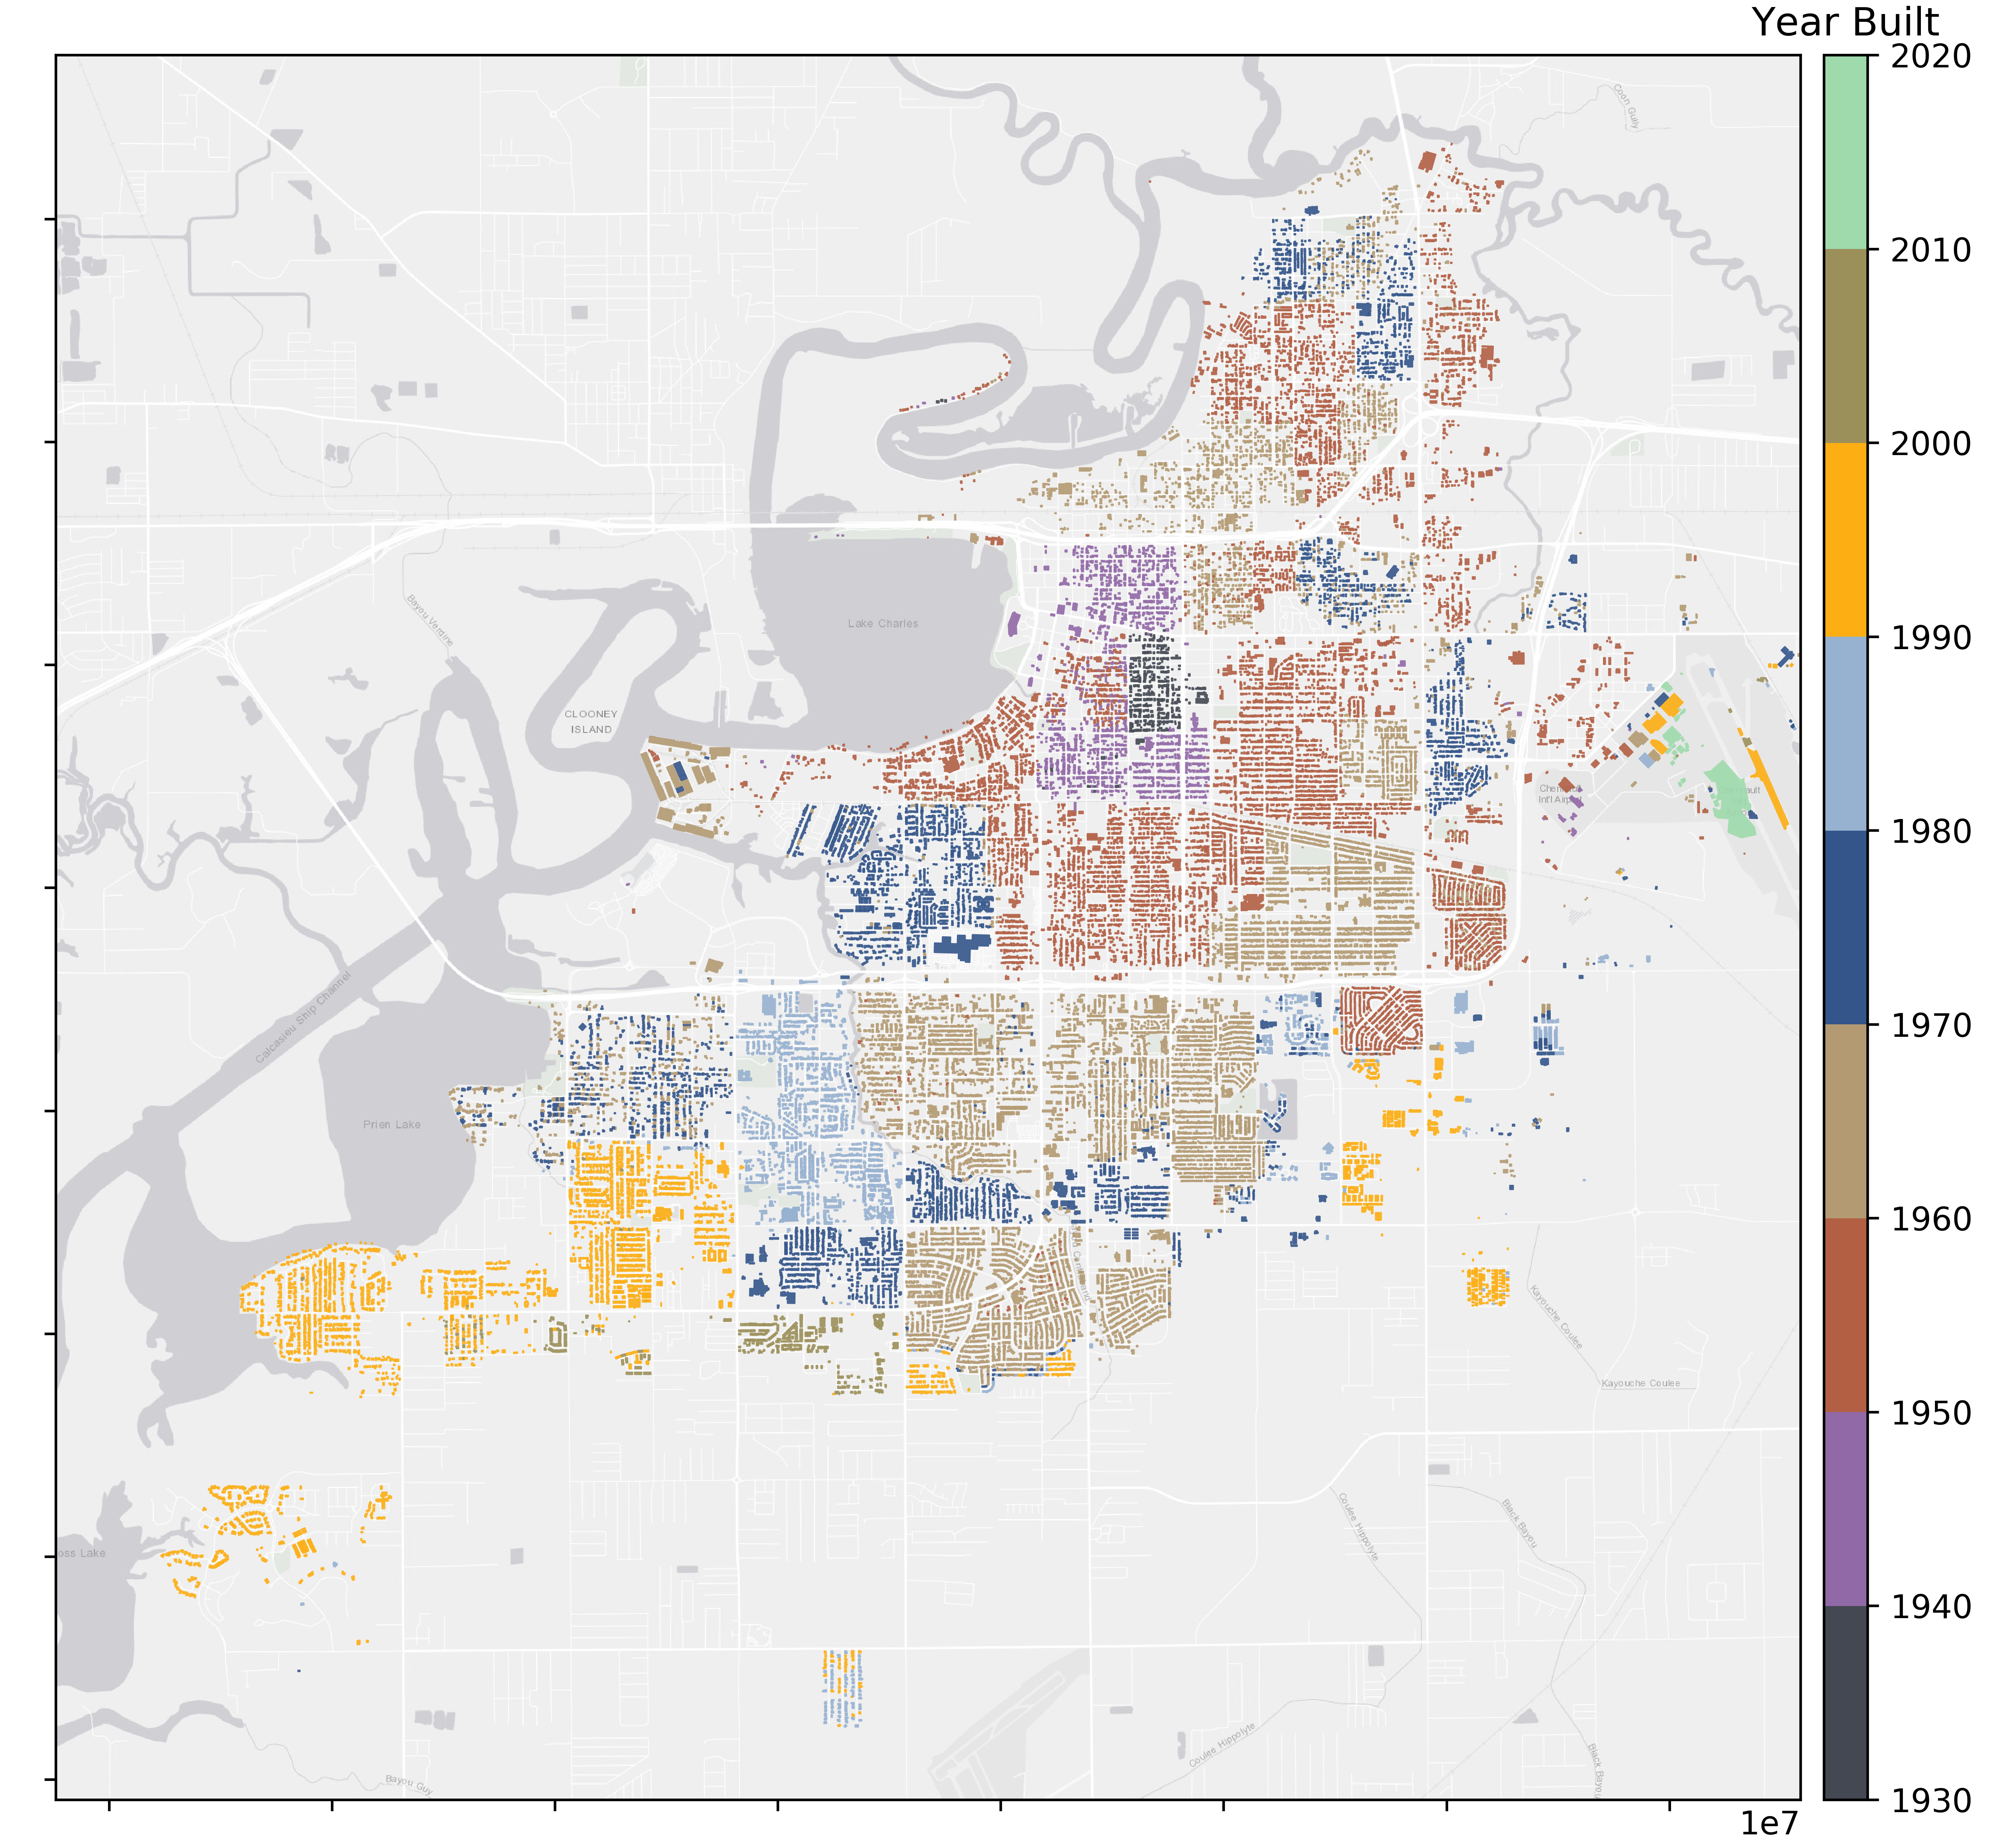
Fig. 3.1.4.1 Geospatial visualization of the building inventory by year built.
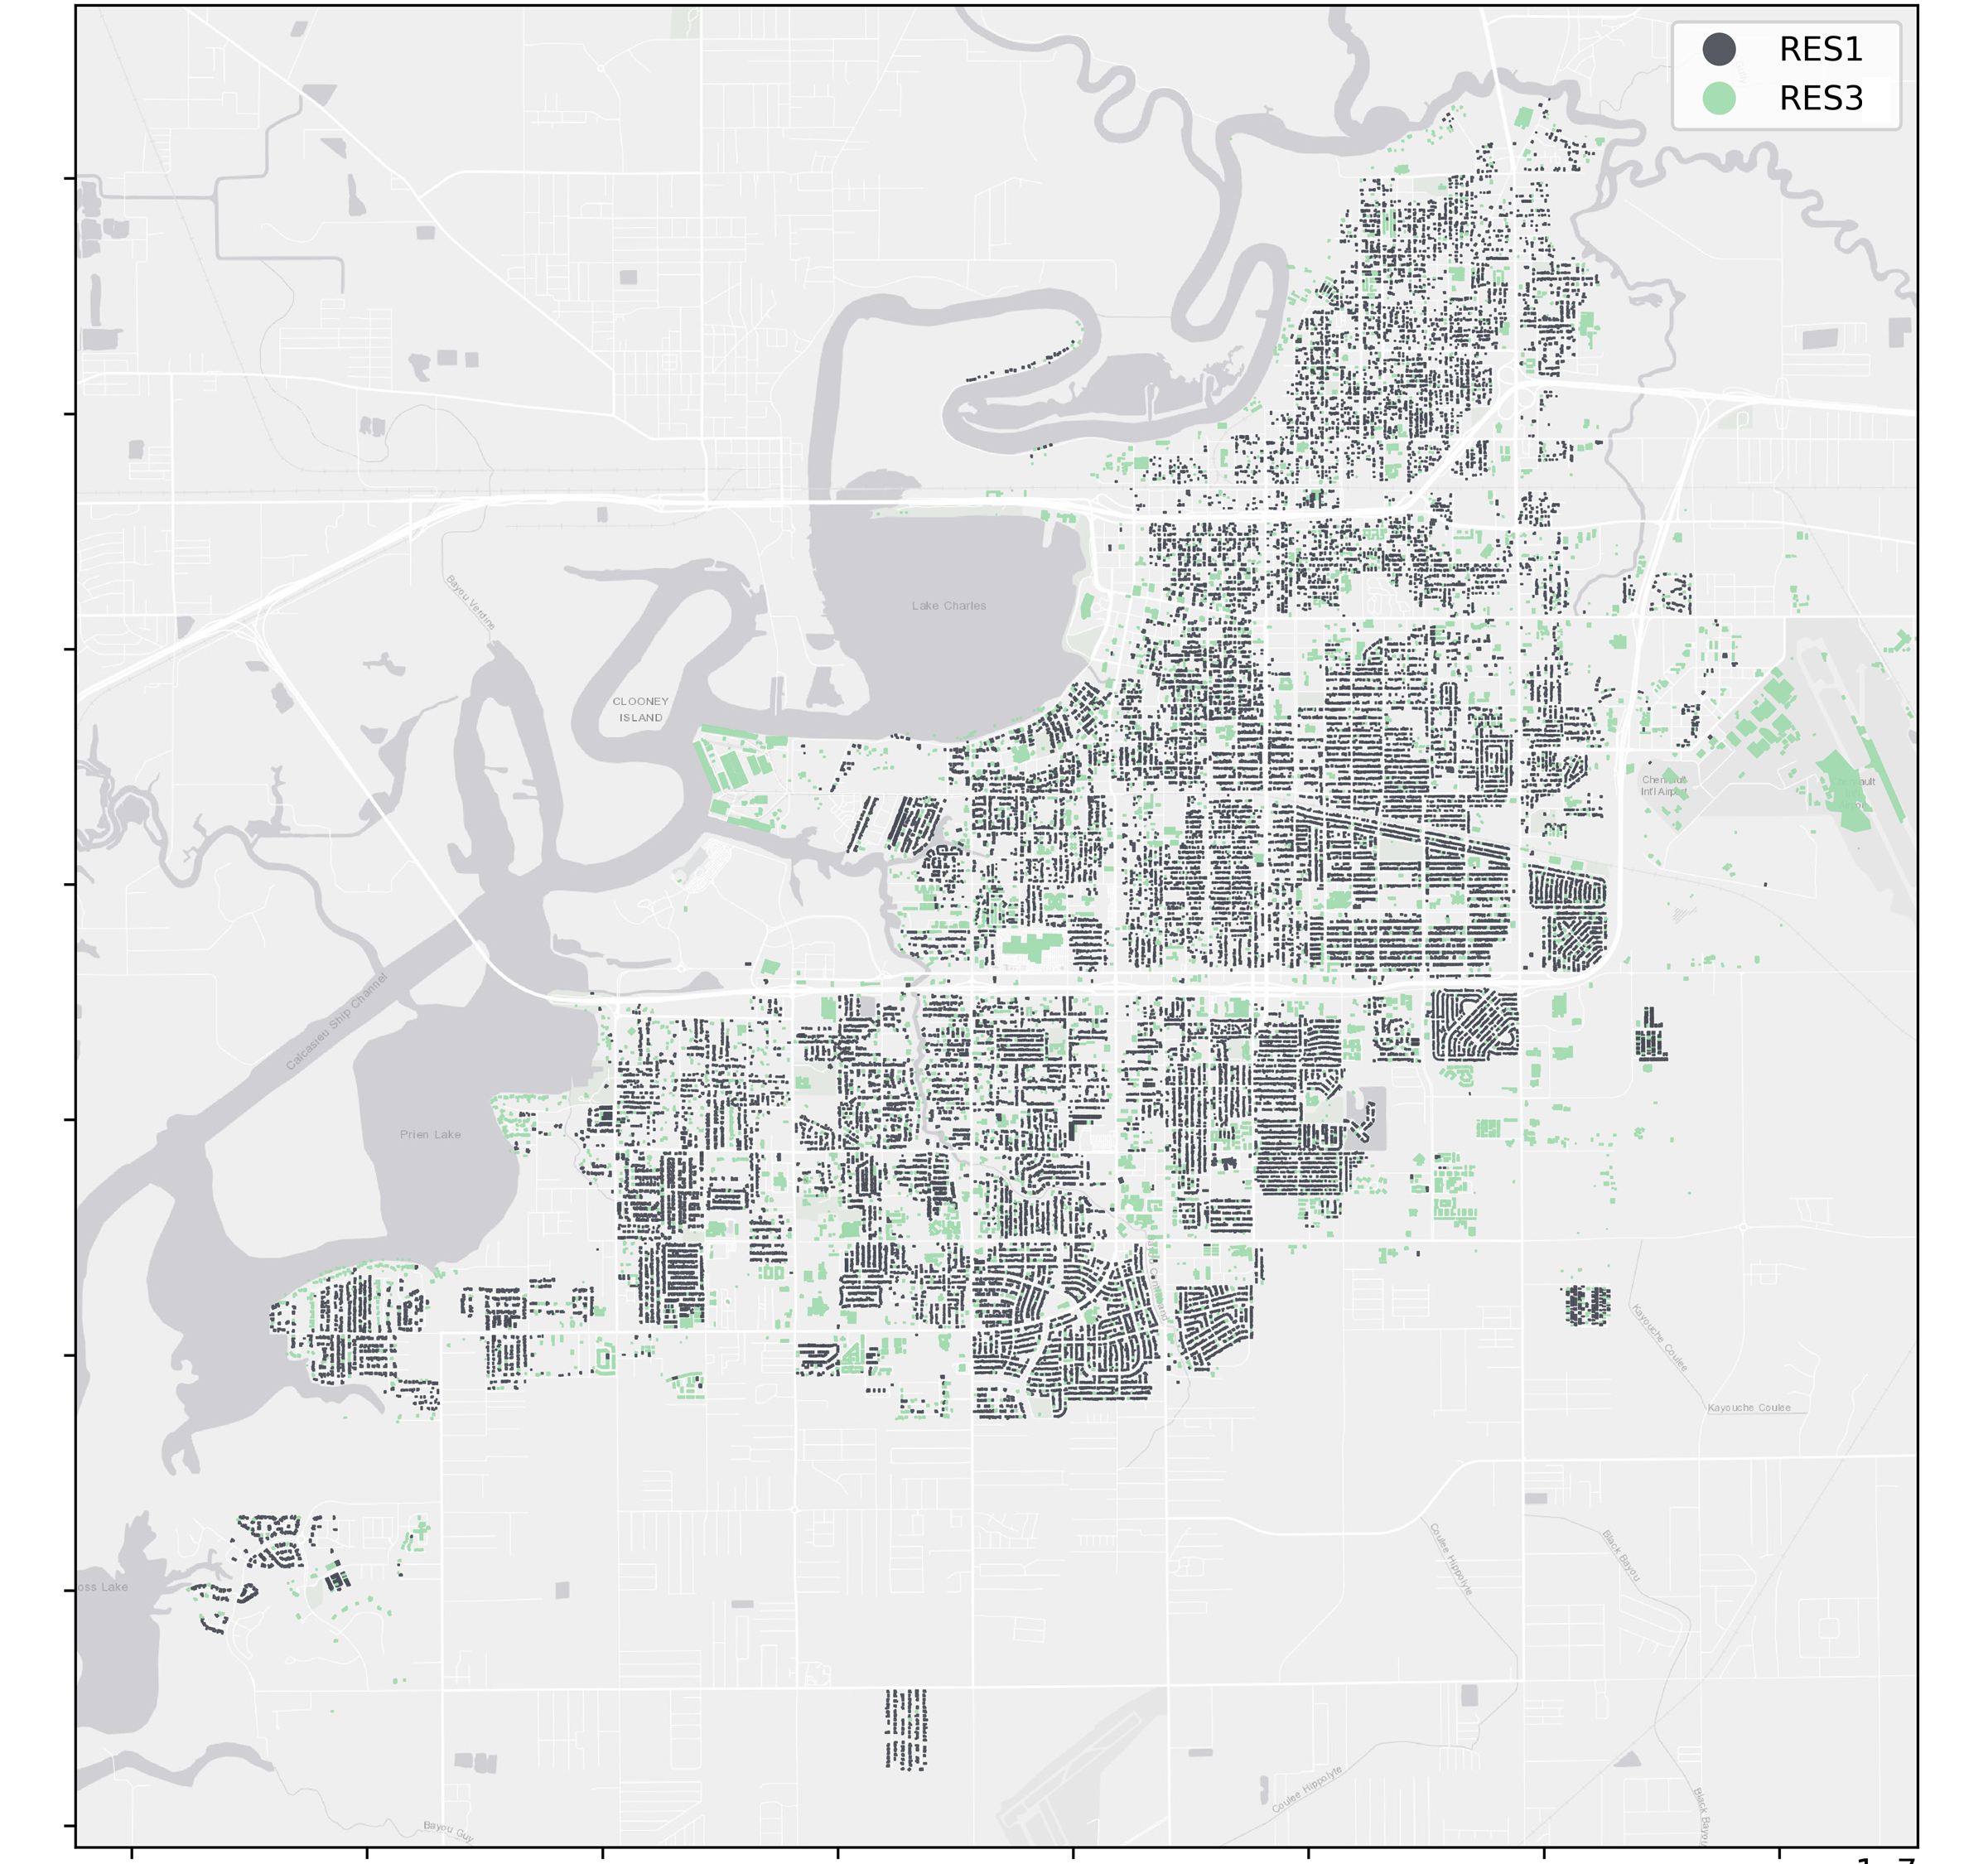
Fig. 3.1.4.2 Geospatial visualization of the building inventory by occupancy class.
Fig. 3.1.4.3 summarizes characteristics of the testbed inventory, including distribution by year built, occupancy class, and number of stories. Notably, these inventories are typified by older vintages of construction (85% of buildings were constructed before 1980), with a dominance of low-rise (1-2 stories) buildings (approximately 98% of inventory buildings). About 88% of buildings are of residential use.
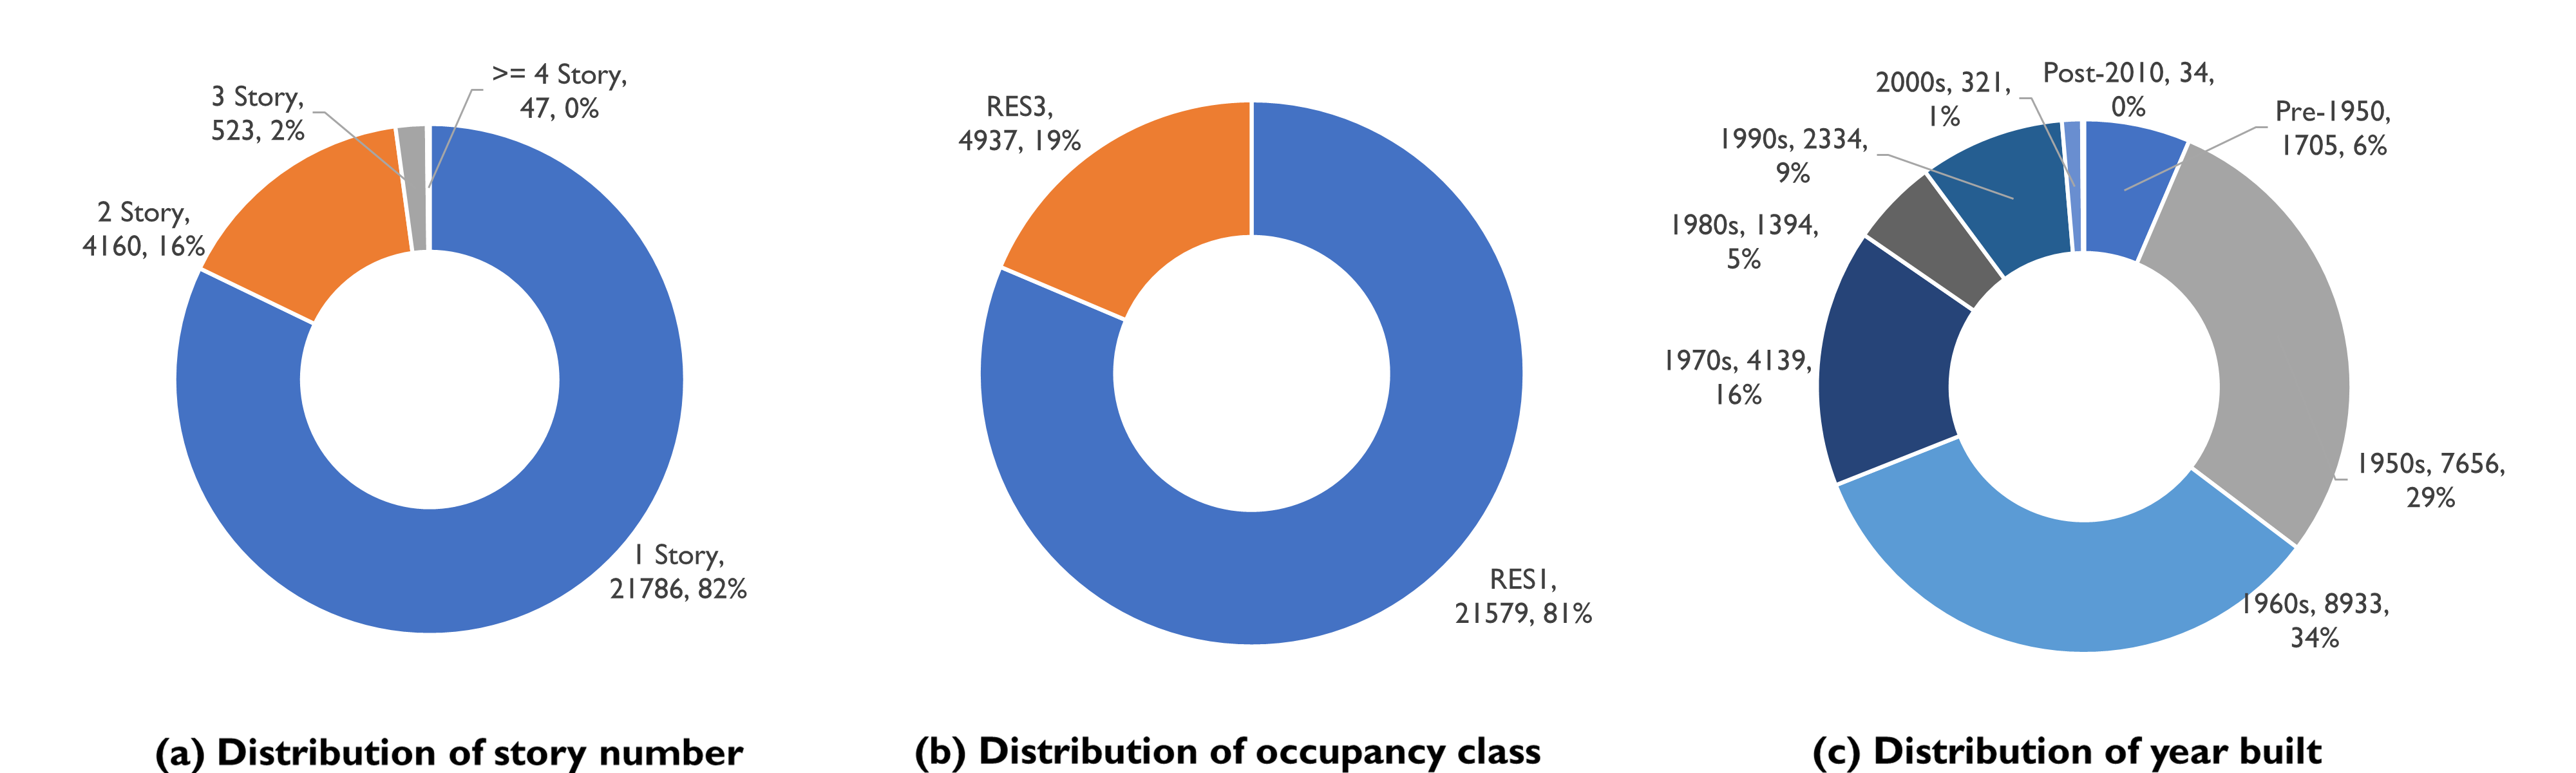
Fig. 3.1.4.3 Distribution of building characteristics of the building inventory.
- Roueche20
Roueche, D., Kameshwar, S., Marshall, J., Mashrur, N., Kijewski-Correa, T., Gurley, K., et al. (2020). Hybrid Preliminary Virtual Reconnaissance Report-Early Access Reconnaissance Report (PVRR-EARR). StEER - Hurricane Laura. DesignSafe-CI. doi:10.17603/ds2-ng93-se16
- ASCE16
ASCE (2016), Minimum Design Loads for Buildings and Other Structures, ASCE 7-16, American Society of Civil Engineers.
- ICC18
International Code Council. (2018). International building code. Falls Church, Va. :International Code Council,
- Pasch21
Pasch, R. J., Berg, R., Roberts, D. P., & Papin, P. P. (2021). National Hurricane Center Tropical Cyclone Report (Hurricane Laura). National Hurricane Center. https://www.nhc.noaa.gov/data/tcr/AL132020_Laura.pdf
- FEMA18
FEMA (2018), HAZUS – Multi-hazard Loss Estimation Methodology 2.1, Hurricane Model Technical Manual, Federal Emergency Management Agency, Washington D.C., 718p.
- ARA20
ARA. (2020). Hurricane Laura Rapid Response Windfield Estimate, Preliminary Windfield Release 3, National Institutes of Standards and Testing & Applied Research Associates, September 4, https://www.designsafe-ci.org/data/browser/public/designsafe.storage.community/Recon%20Portal/2020%20Hurricane%20Laura%20Cameron%20Louisiana%20USA.