4.4. AutoSDA and Nonlinear Response Analysis
This example demonstrates the use of a Python-based computation platform to automate seismic design and analysis of of steel moment resisting frames (AutoSDA) ([GBS20]).
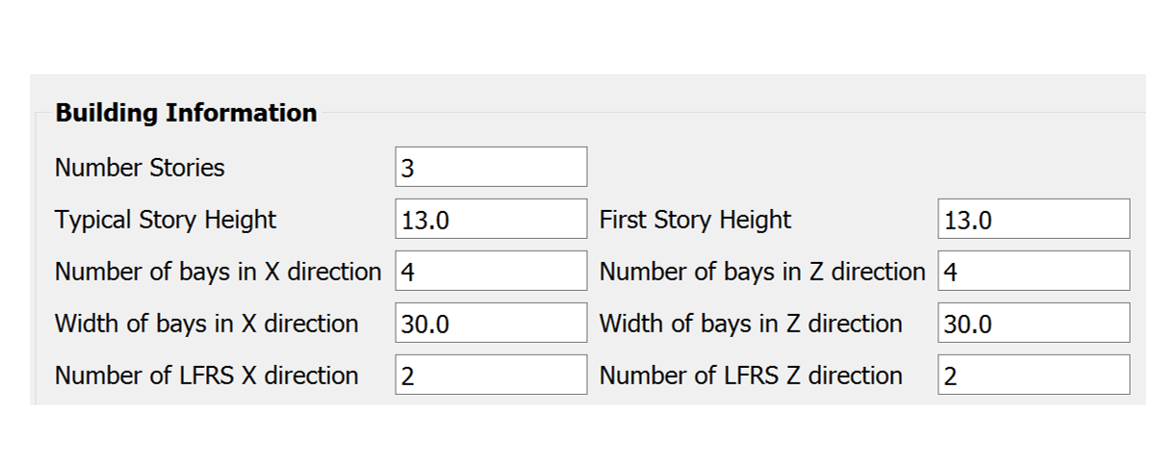
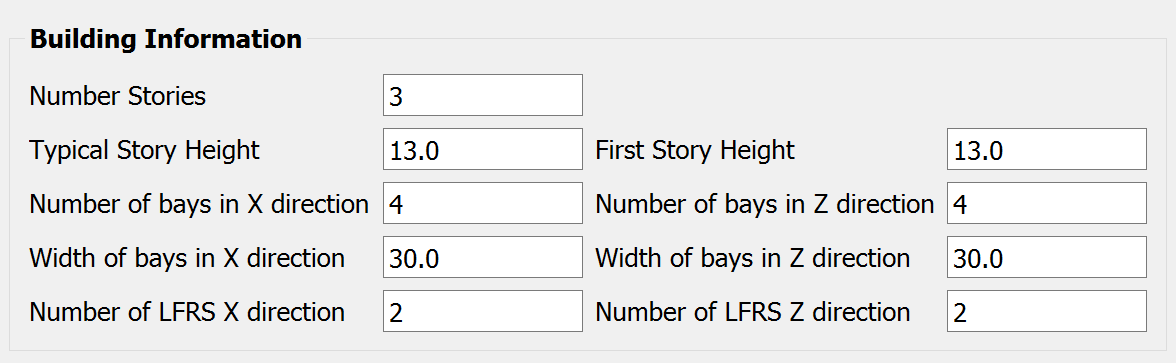
Fig. 4.4.1 Basic building information in AutoSDA
4.4.1. Design and create a numerical model
Navigate to the SIM tab in the left menu. In this panel, select the Steel Building Model as the Building Model Generator. In the user interface, five major input sections: (1) Building Information, (2) ELF Parameters, (3) Member Depth, (4) Loading, and (5) Building Data Files.
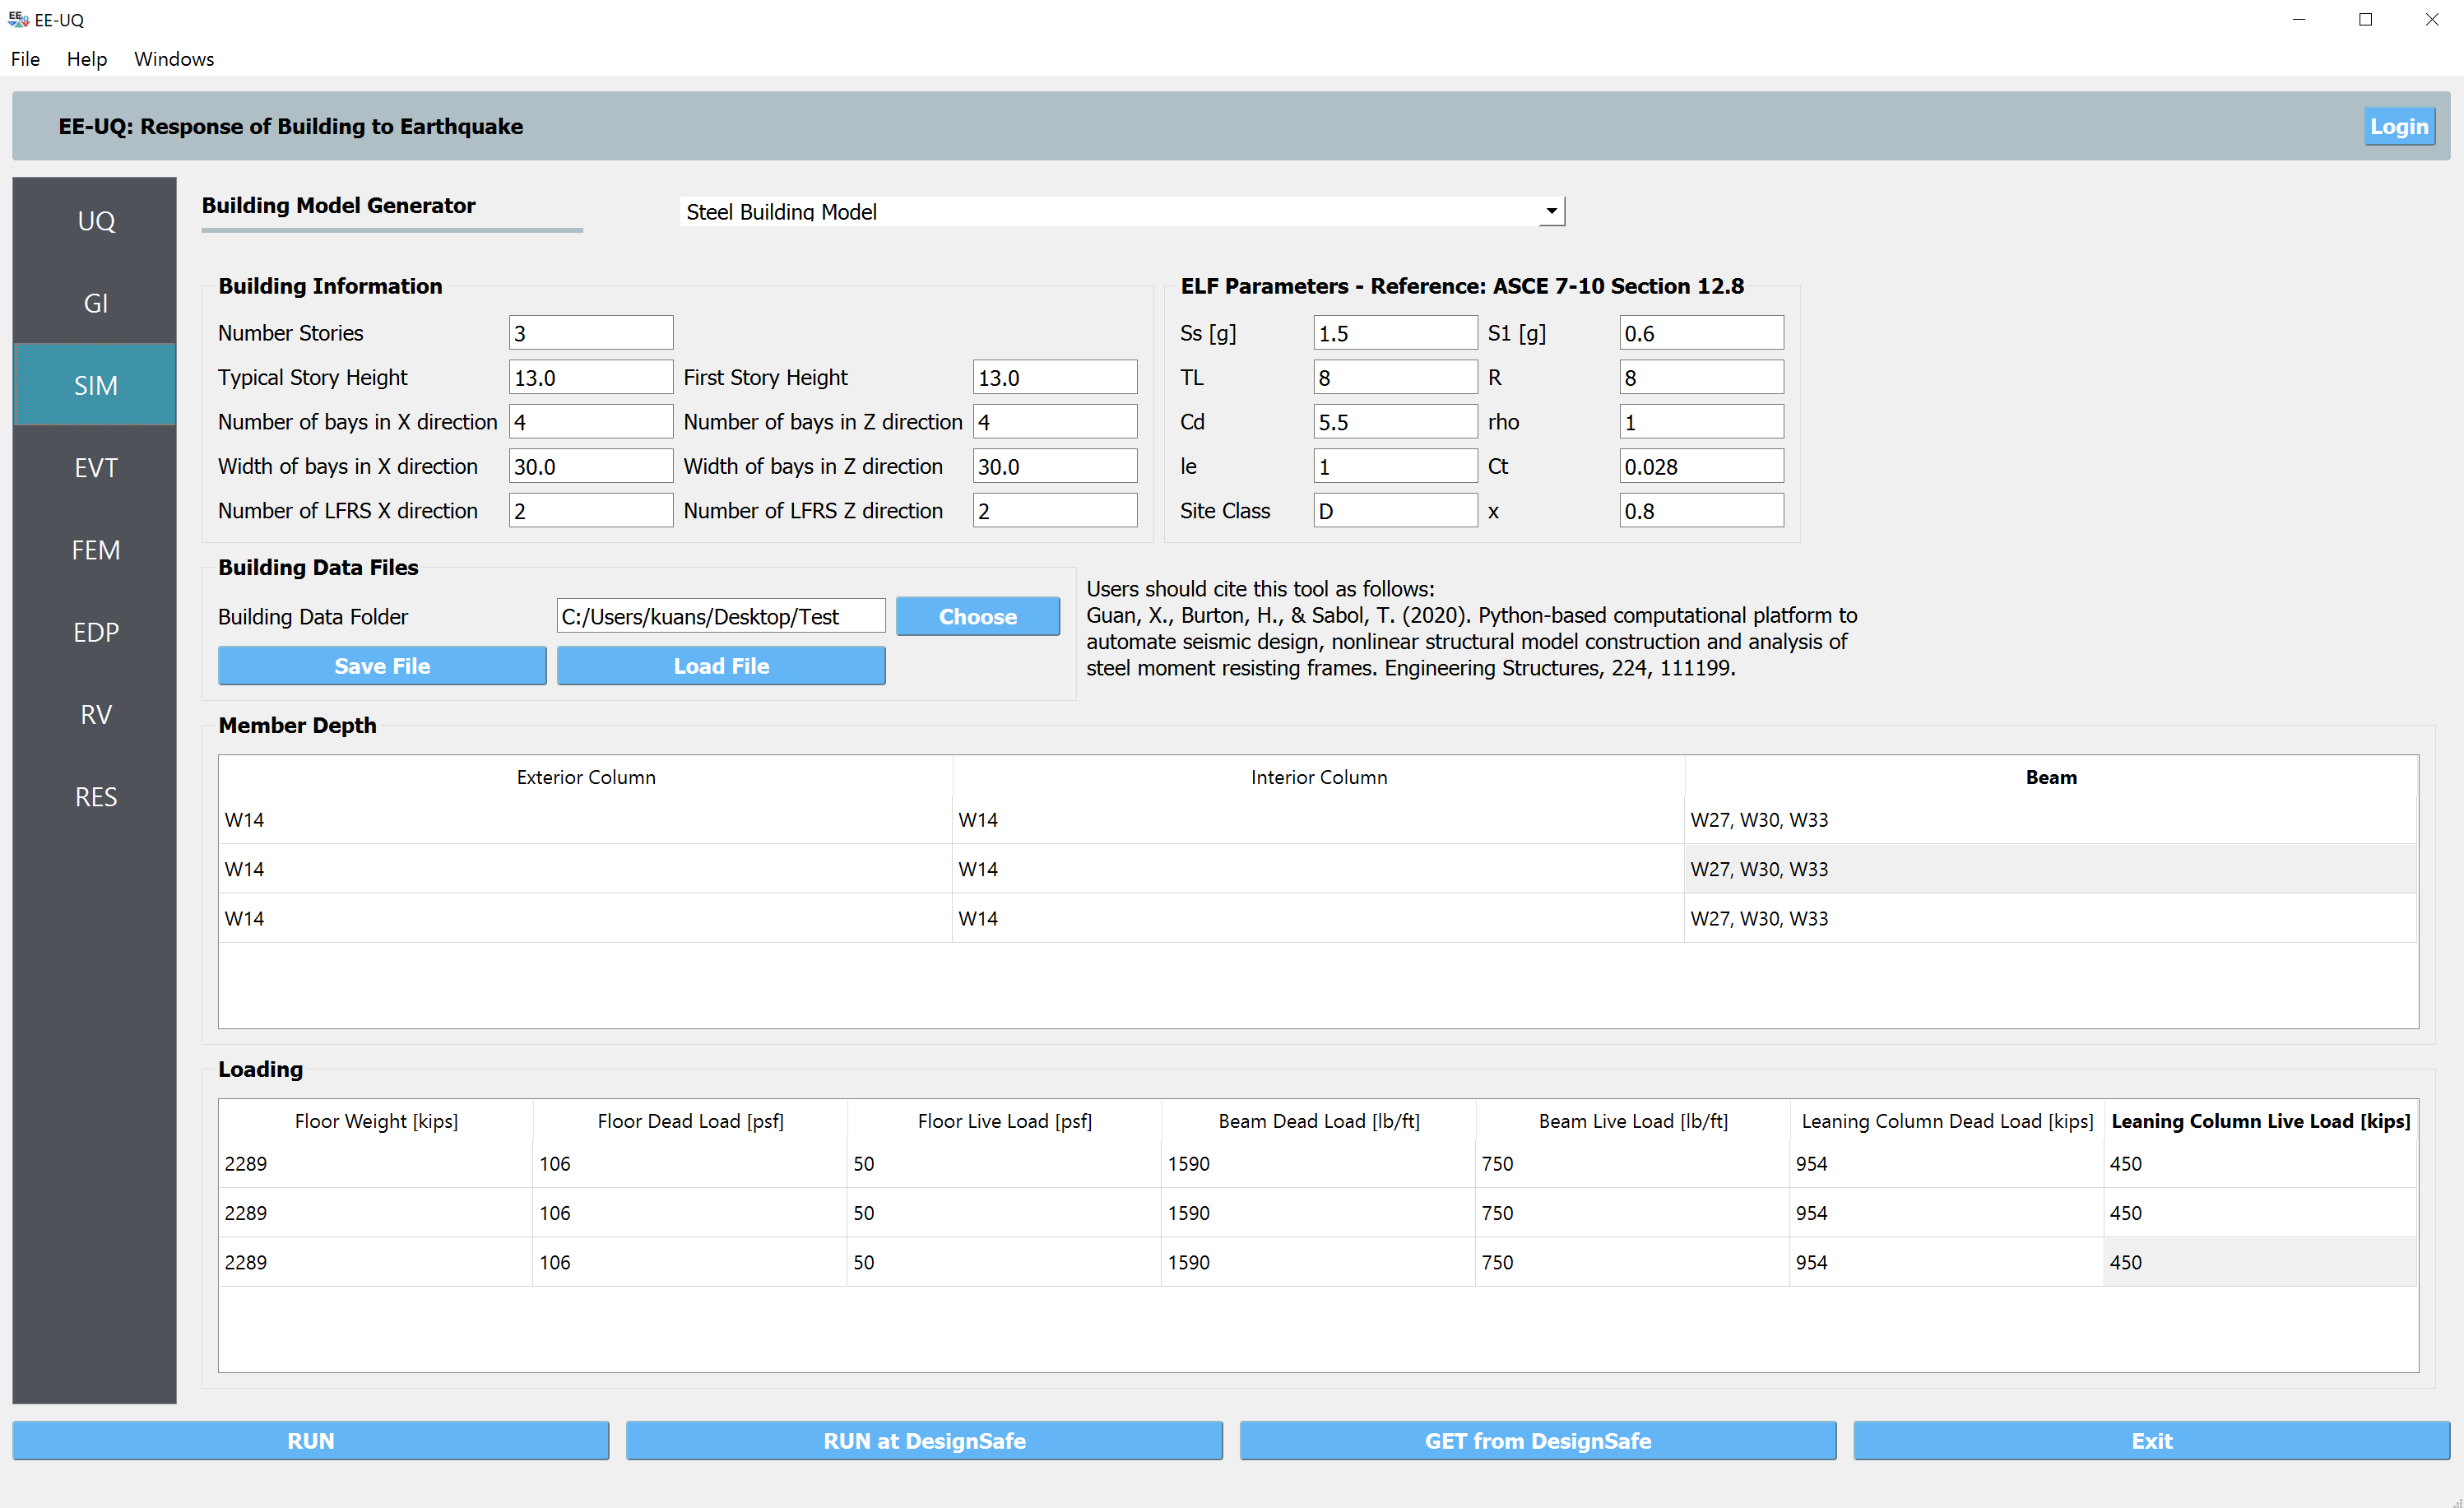
In the Building Information section, we define the number of stories of the example steel moment frame to 3 and the uniform story height to 13.0 ft. There are 4 bays in both horizontal directions with a uniform bay width of 30 ft.
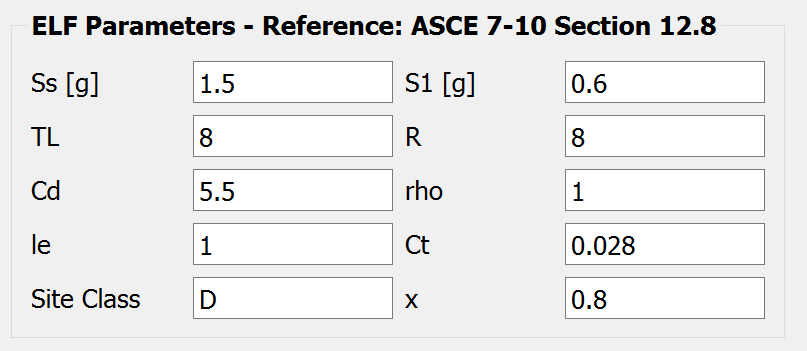
3. In the ELF Parameters section, the seismic design parameters box contains the Equivalent Lateral Force (ELF) design parameters as specified by ASCE 7-10. For the example frame, we assume \(Ss = 1.5g\) and \(S1 = 0.6\) with a site class of D. The frame is designed with a \(R\) factor of 8.
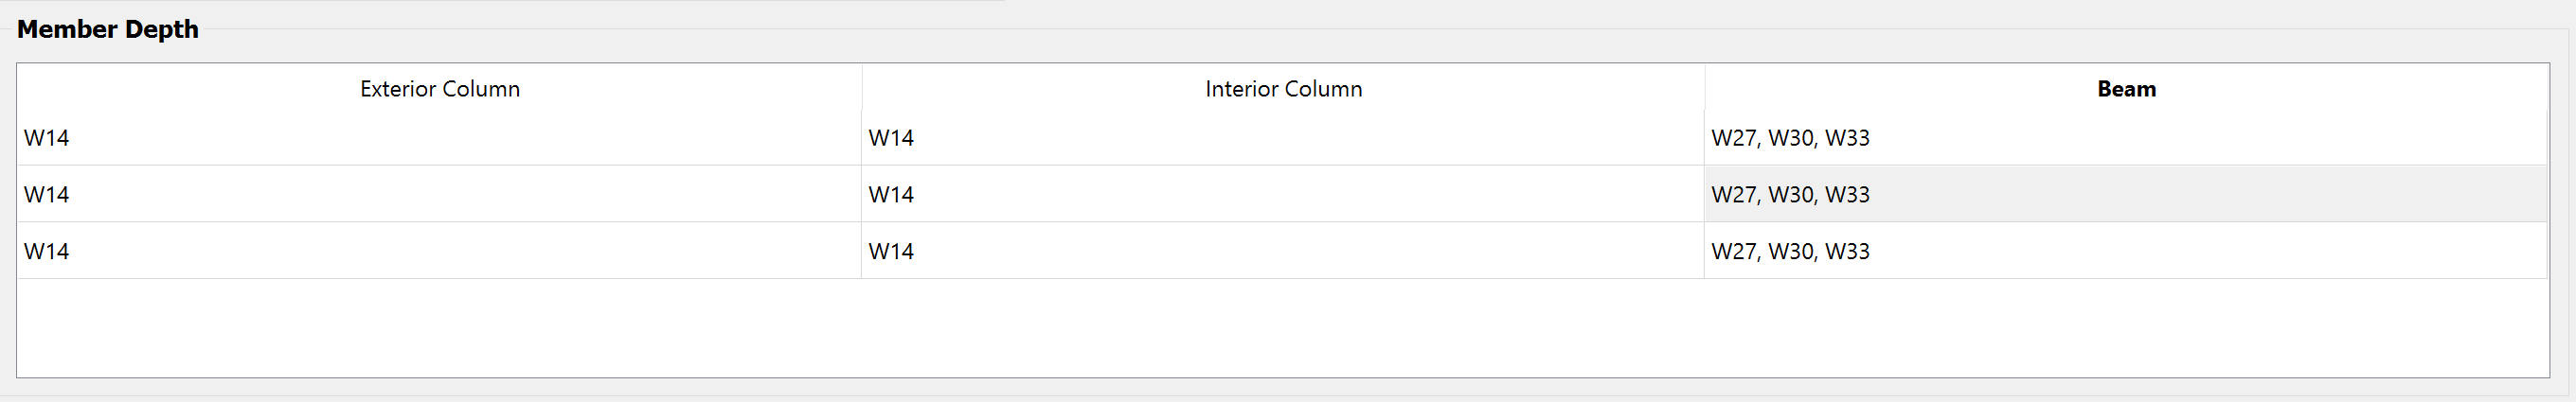
In the Member Depth section, users can specify cross sections in the table list for the interior columns, exterior columns, and beams. Starting from top to bottom, each row corresponds to one story from bottom story to top story. In this example, we simplify all columns to have the same \(W14\) section, and use three sections for beams.
In the Loading section, users can specify the loading values for the floors, beams, and columns. And for the top story, the live load on the leaning column is specified to be a random variable \(DL\) with a uniform distribution from 450 kips to 550 kips (as defined in the RV panel).
![A screenshot of a table labeled "Loading" with six columns titled Floor Weight [kips], Floor Dead Load [psf], Floor Live Load [psf], Beam Dead Load [lb/ft], Beam Live Load [lb/ft], Leaning Column Dead Load [kips], and Leaning Column Live Load [kips]. Each column contains three identical numerical entries, with "2289" under Floor Weight, "106" under Floor Dead Load, "50" under Floor Live Load, "1590" under Beam Dead Load, "750" under Beam Live Load, "954" under Leaning Column Dead Load, and "450" under Leaning Column Live Load.](../../../../../_images/ldg.png)
In the Building Data Files section, clicking the Save File button will automatically generate four modeling data files in the user-defined location (ELFParameters.csv, Geometry.csv, Loads.csv, and MemberDepth.csv). These four files store the data from the four discussed sections above. Users can also directly modify these data tables.

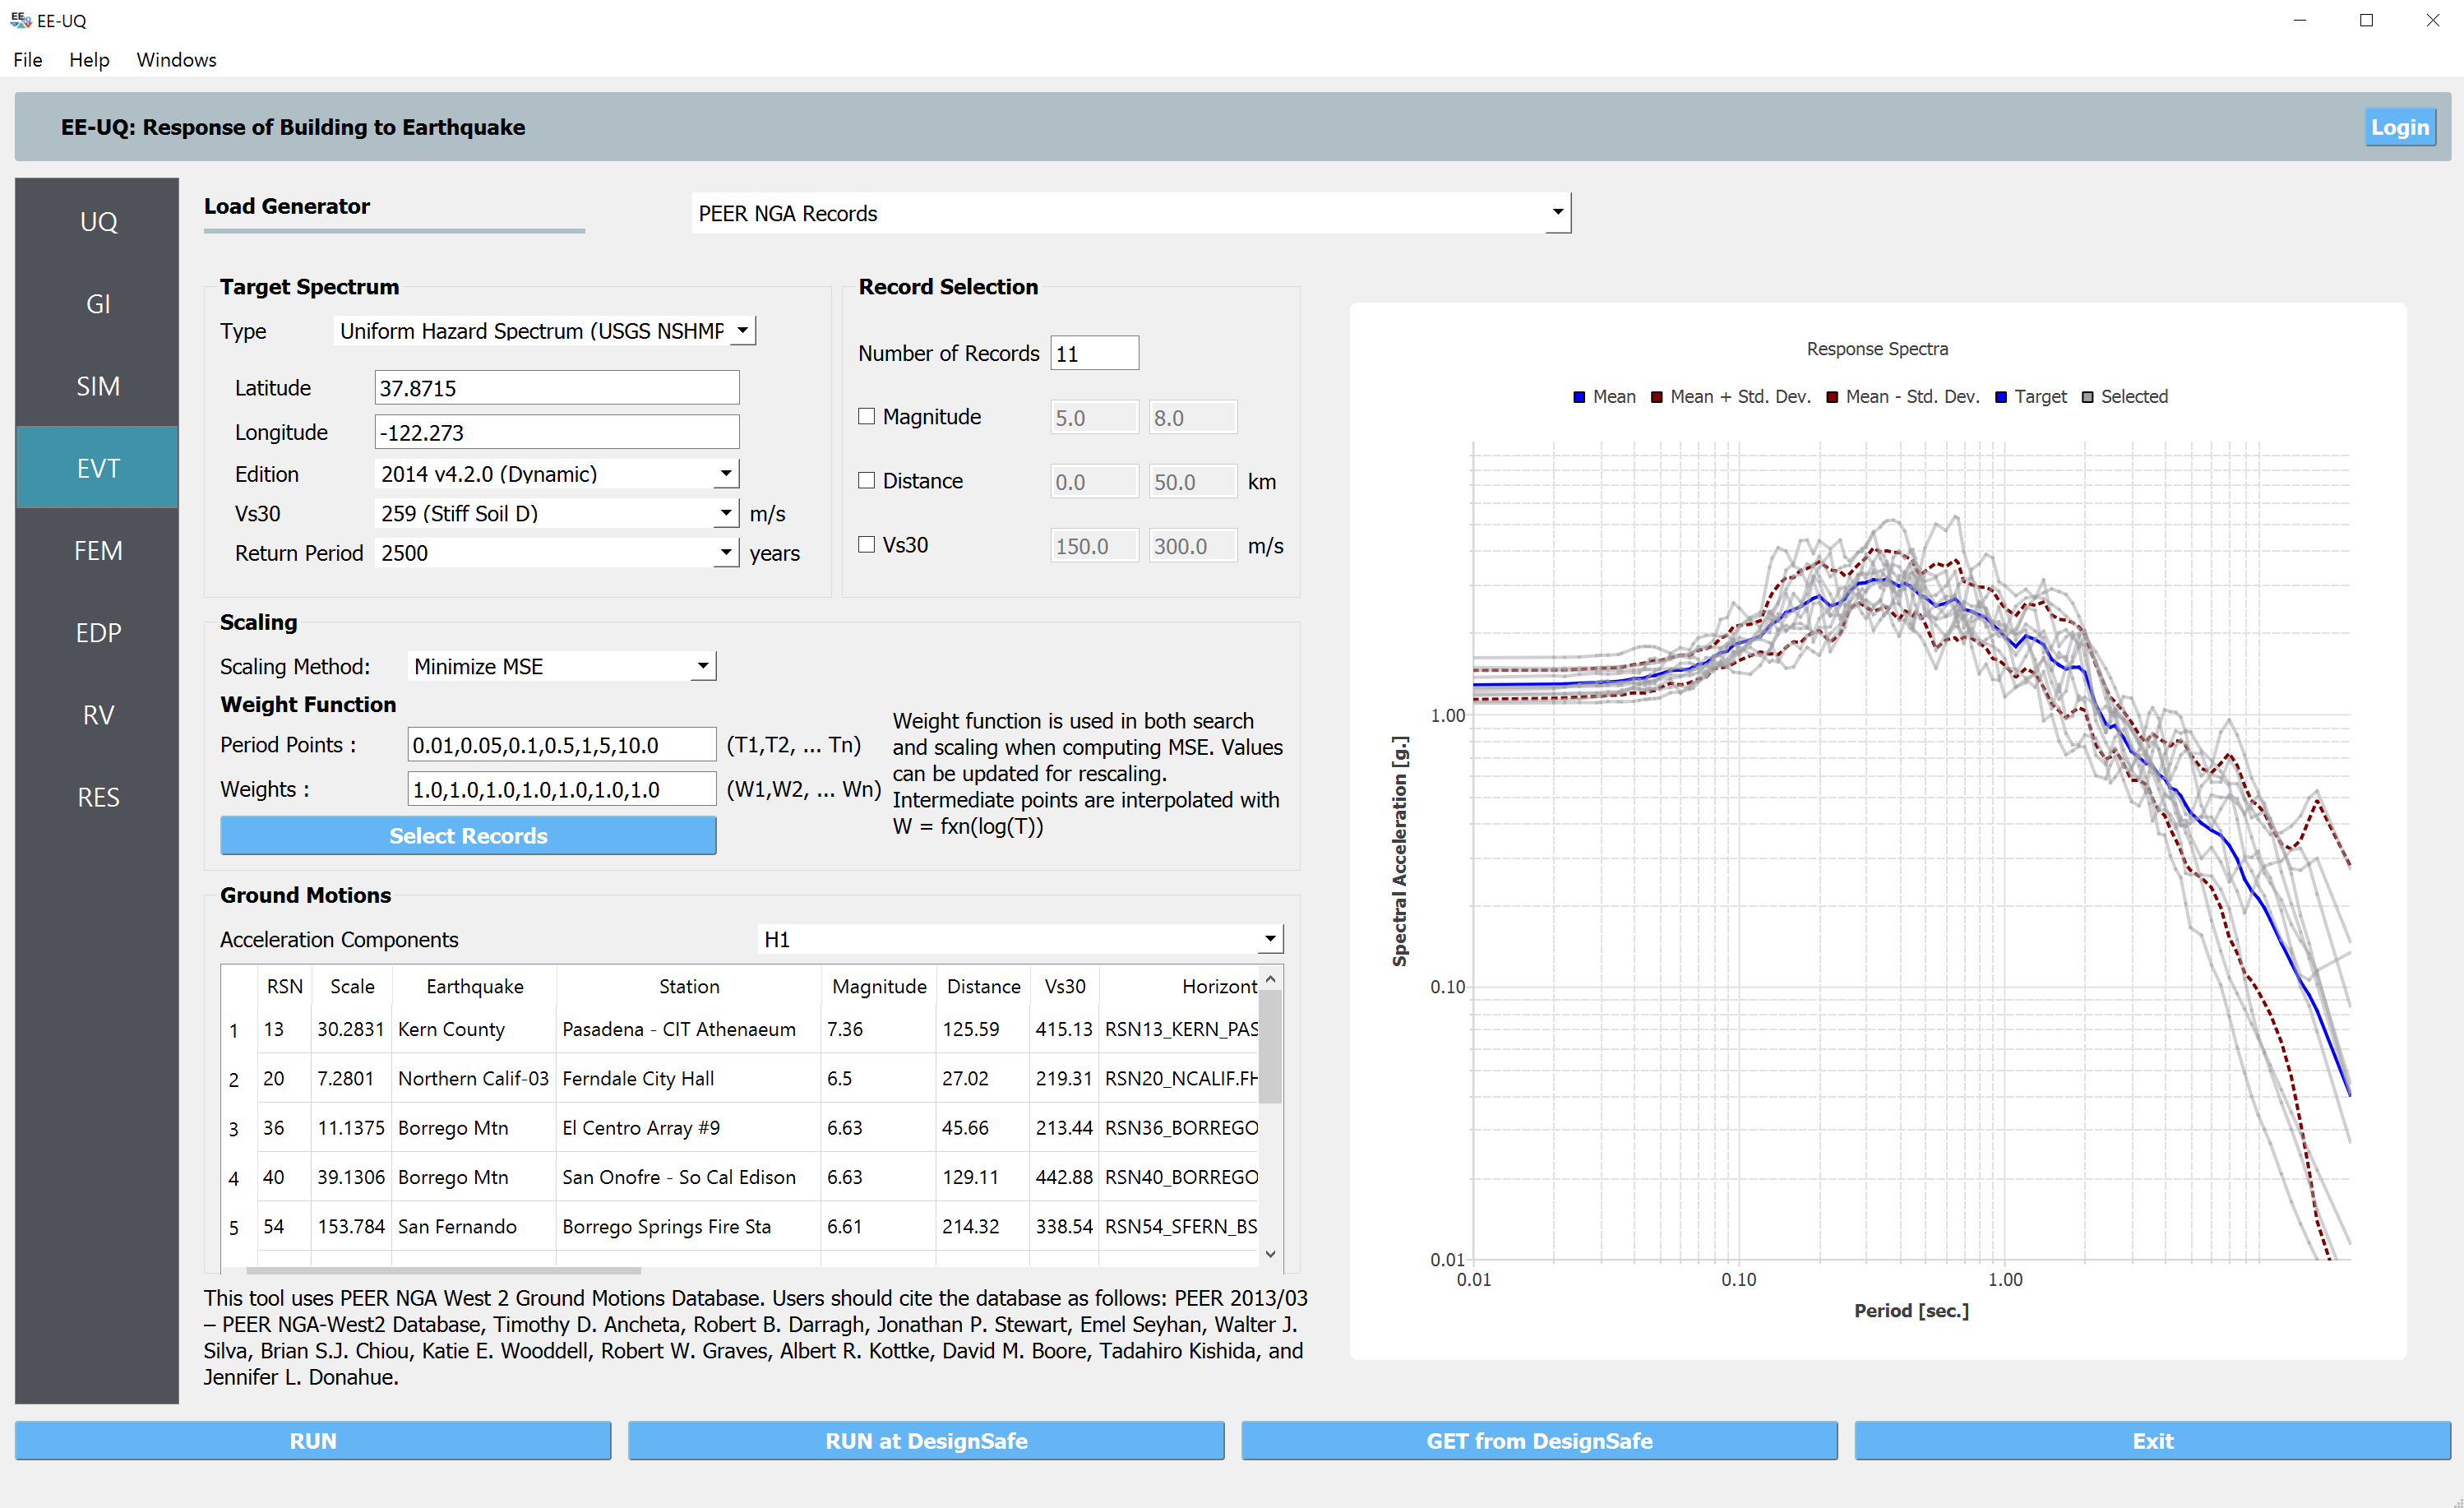
4.4.2. Select and scale ground motion records
Navigate to the EVT panel and select the PEER NGA Records as the Load Generator. We can use the Uniform Hazard Spectrum as an example target spectrum here. We can specify the site location, the site class (D) and the return period (2500 years). Then on the left panel, please specify the number of records with optional filters on the earthquake magnitude, site-source distance, and \(V_{S30}\).
In the Scaling panel, we could use the Minimize MSE as the Scaling Method which will compute and minimize the mean standard error between the average response spectrum and the target spectrum. You can specify a set of periods and corresponding error-calculation weights.
Note
As specified by ASCE 7-16, you may want to let the period points at least cover the \(0.2T_1\) to \(1.5T_1\) (\(T_1\) is the fundamental period of the structure).
For the 2D model in this example, we should use the acceleration components H1 or H2, while the other options (GeoMean, RotD50, and RotD100) are available for 3D models.
Once set up the configurations above, please click the Select Records which will connect the PEER NGA West Ground Motion Database. You could use your account and password to log in and execute the selection and scaling.
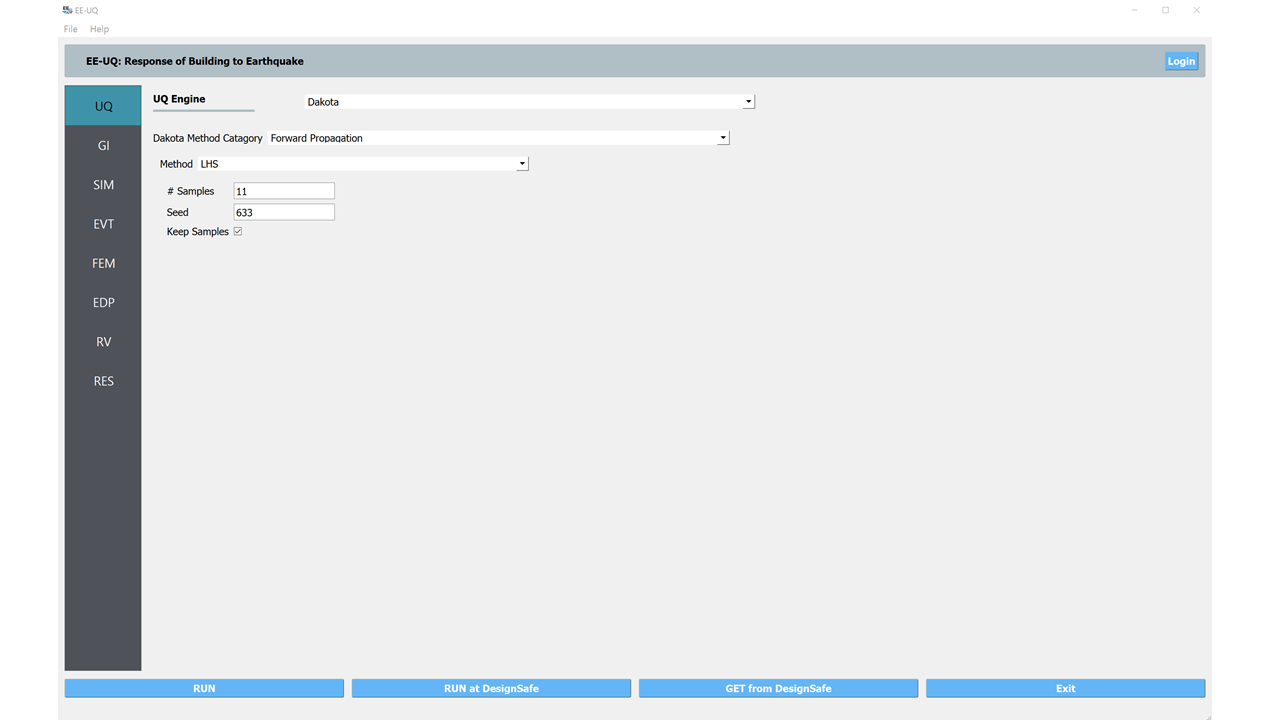
4.4.3. Run the analysis and post-process results
Navigate to the UQ panel, use the default Forward Propagation method with the # Sample same as the number of selected records.
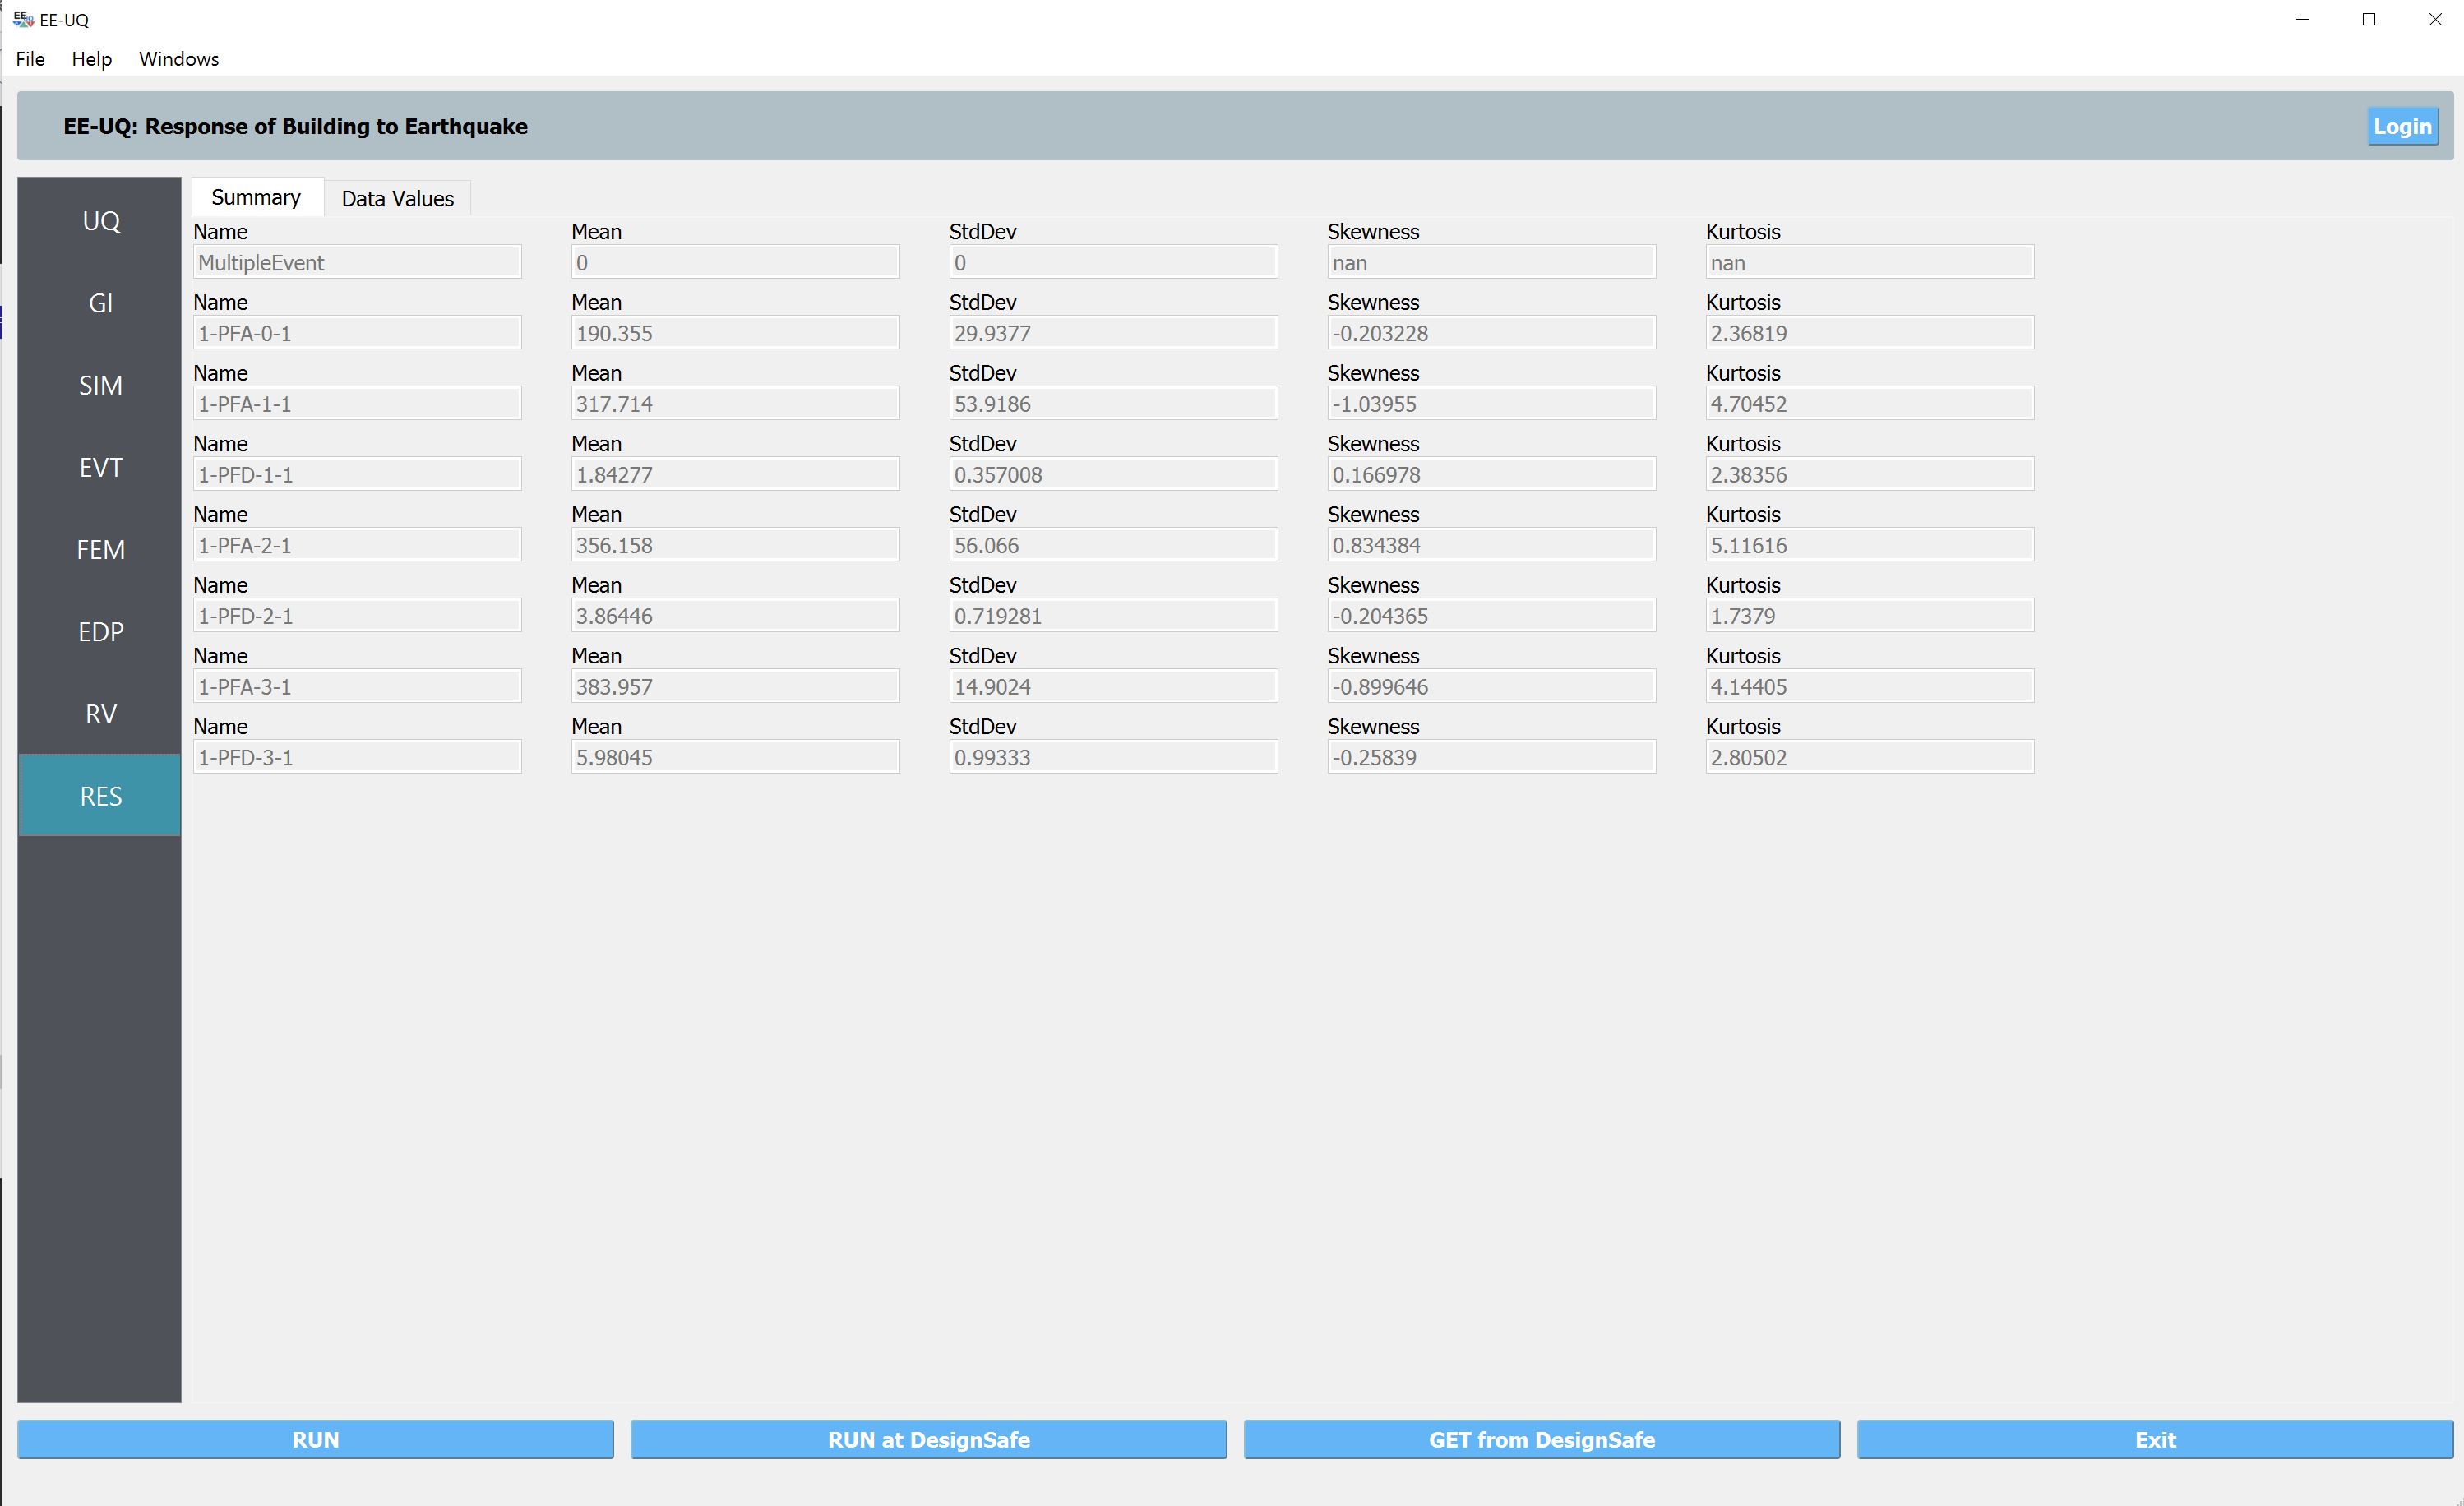
Next click on the Run button. This will cause the backend application to launch the analysis. When done the RES panel will be selected and the results will be displayed. The results show the values of the mean and standard deviation as before but now only for the one quantity of interest.
Xingquan Guan, Henry Burton, and Thomas Sabol. Python-based computational platform to automate seismic design, nonlinear structural model construction and analysis of steel moment resisting frames. Engineering Structures, 224:111199, 2020.