2.13. RES: Results
The Results panel is where the user can review the results of an analysis. Currently, the results post-processor supports output from the following applications:
2.13.1. Pelicun Damage and Loss
Fig. 2.13.1.1 shows the results panel for the Pelicun Damage and Loss application. The results panel consists of several docking windows that can be moved, rearranged, resized, and opened and closed by the user. The results panel contains these main docks:
Regional Map Dock: Displays a geographic map highlighting the assets within the analyzed region. Assets are color-coded based on their most likely critical damage state. Clicking on an asset reveals a popup with detailed information about it.
Note
The term ‘critical damage state’ refers to the highest level of damage sustained by any of the asset’s components. In the context of asset-level damage assessment (e.g., Hazus-MH EQ IM), an asset is evaluated based on multiple components, each susceptible to different types of hazard intensity measures. For instance, a building’s vulnerability may be assessed in terms of both ground shaking (PGA) and ground failure (PGD) components. The critical damage state is determined by the largest damage state of these components, with the ‘Most likely’ critical damage state being identified as the mode across all realizations of damage state generated by Pelicun. For further details on Pelicun’s output and methodology, refer to the [Pelicun Documentation](https://nheri-simcenter.github.io/pelicun/common/user_manual/usage/pelicun/outputs.html). The process involves identifying a critical damage state for each realization, with the mode of these states representing the most likely outcome.
Detailed Building Results Dock: This table presents a detailed breakdown of the results for each asset, including:
Asset ID
Mean and standard deviation of repair cost
Mean and standard deviation of repair time
Mean and standard deviation of the most likely damage state
The table can be sorted in descending order based on any of these metrics using the Table Sort combo box, as depicted in Fig. 2.13.1.1.
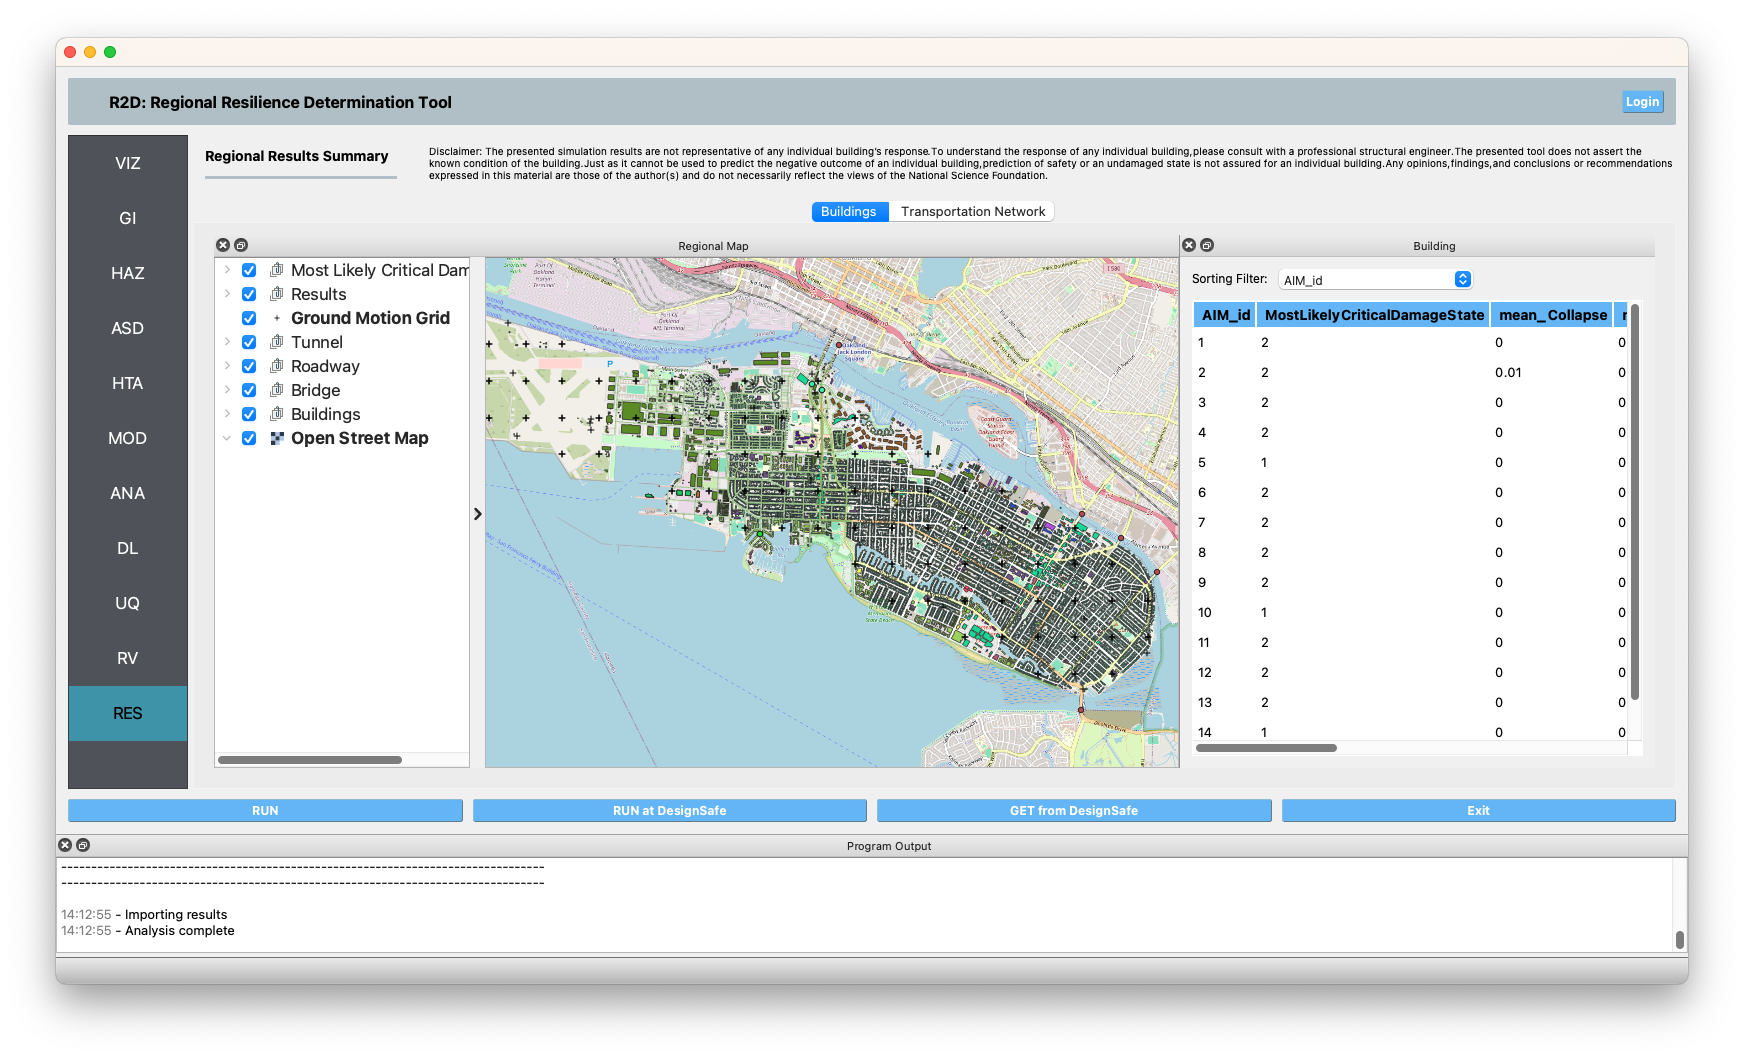
Fig. 2.13.1.1 Pelicun results visualization panel.
2.13.2. REWET System Performance Result
When you run a System Performance module (e.g., REWET), R2DTool produces results regarding system performance assessment. These data are shown in the GIS and Tabular format in the results section, similar to Pelicun’s Loss and Damage data model. Besides that, system-wide curves, which describe the functionality of the network according to a metric, shown widget on the right side of the app ( Fig. 2.13.2.1). REWET’s specific data consist of:
Total Outage Time: This is the total time that each junction did not provide service level (Basic Service Category [Davis21]), i.e., the total amount of time each junction could not deliver water (Water Delivery) and water quantity as much as needed (Water Quantity).
Network Performance Curves: By knowing the state of each junction at each time, R2DTool assesses the percentage of the nodes that are at each status at each time of the simulation. Then, Network Performance Curves are created for Delivery and Quantity BSC [Davis21].
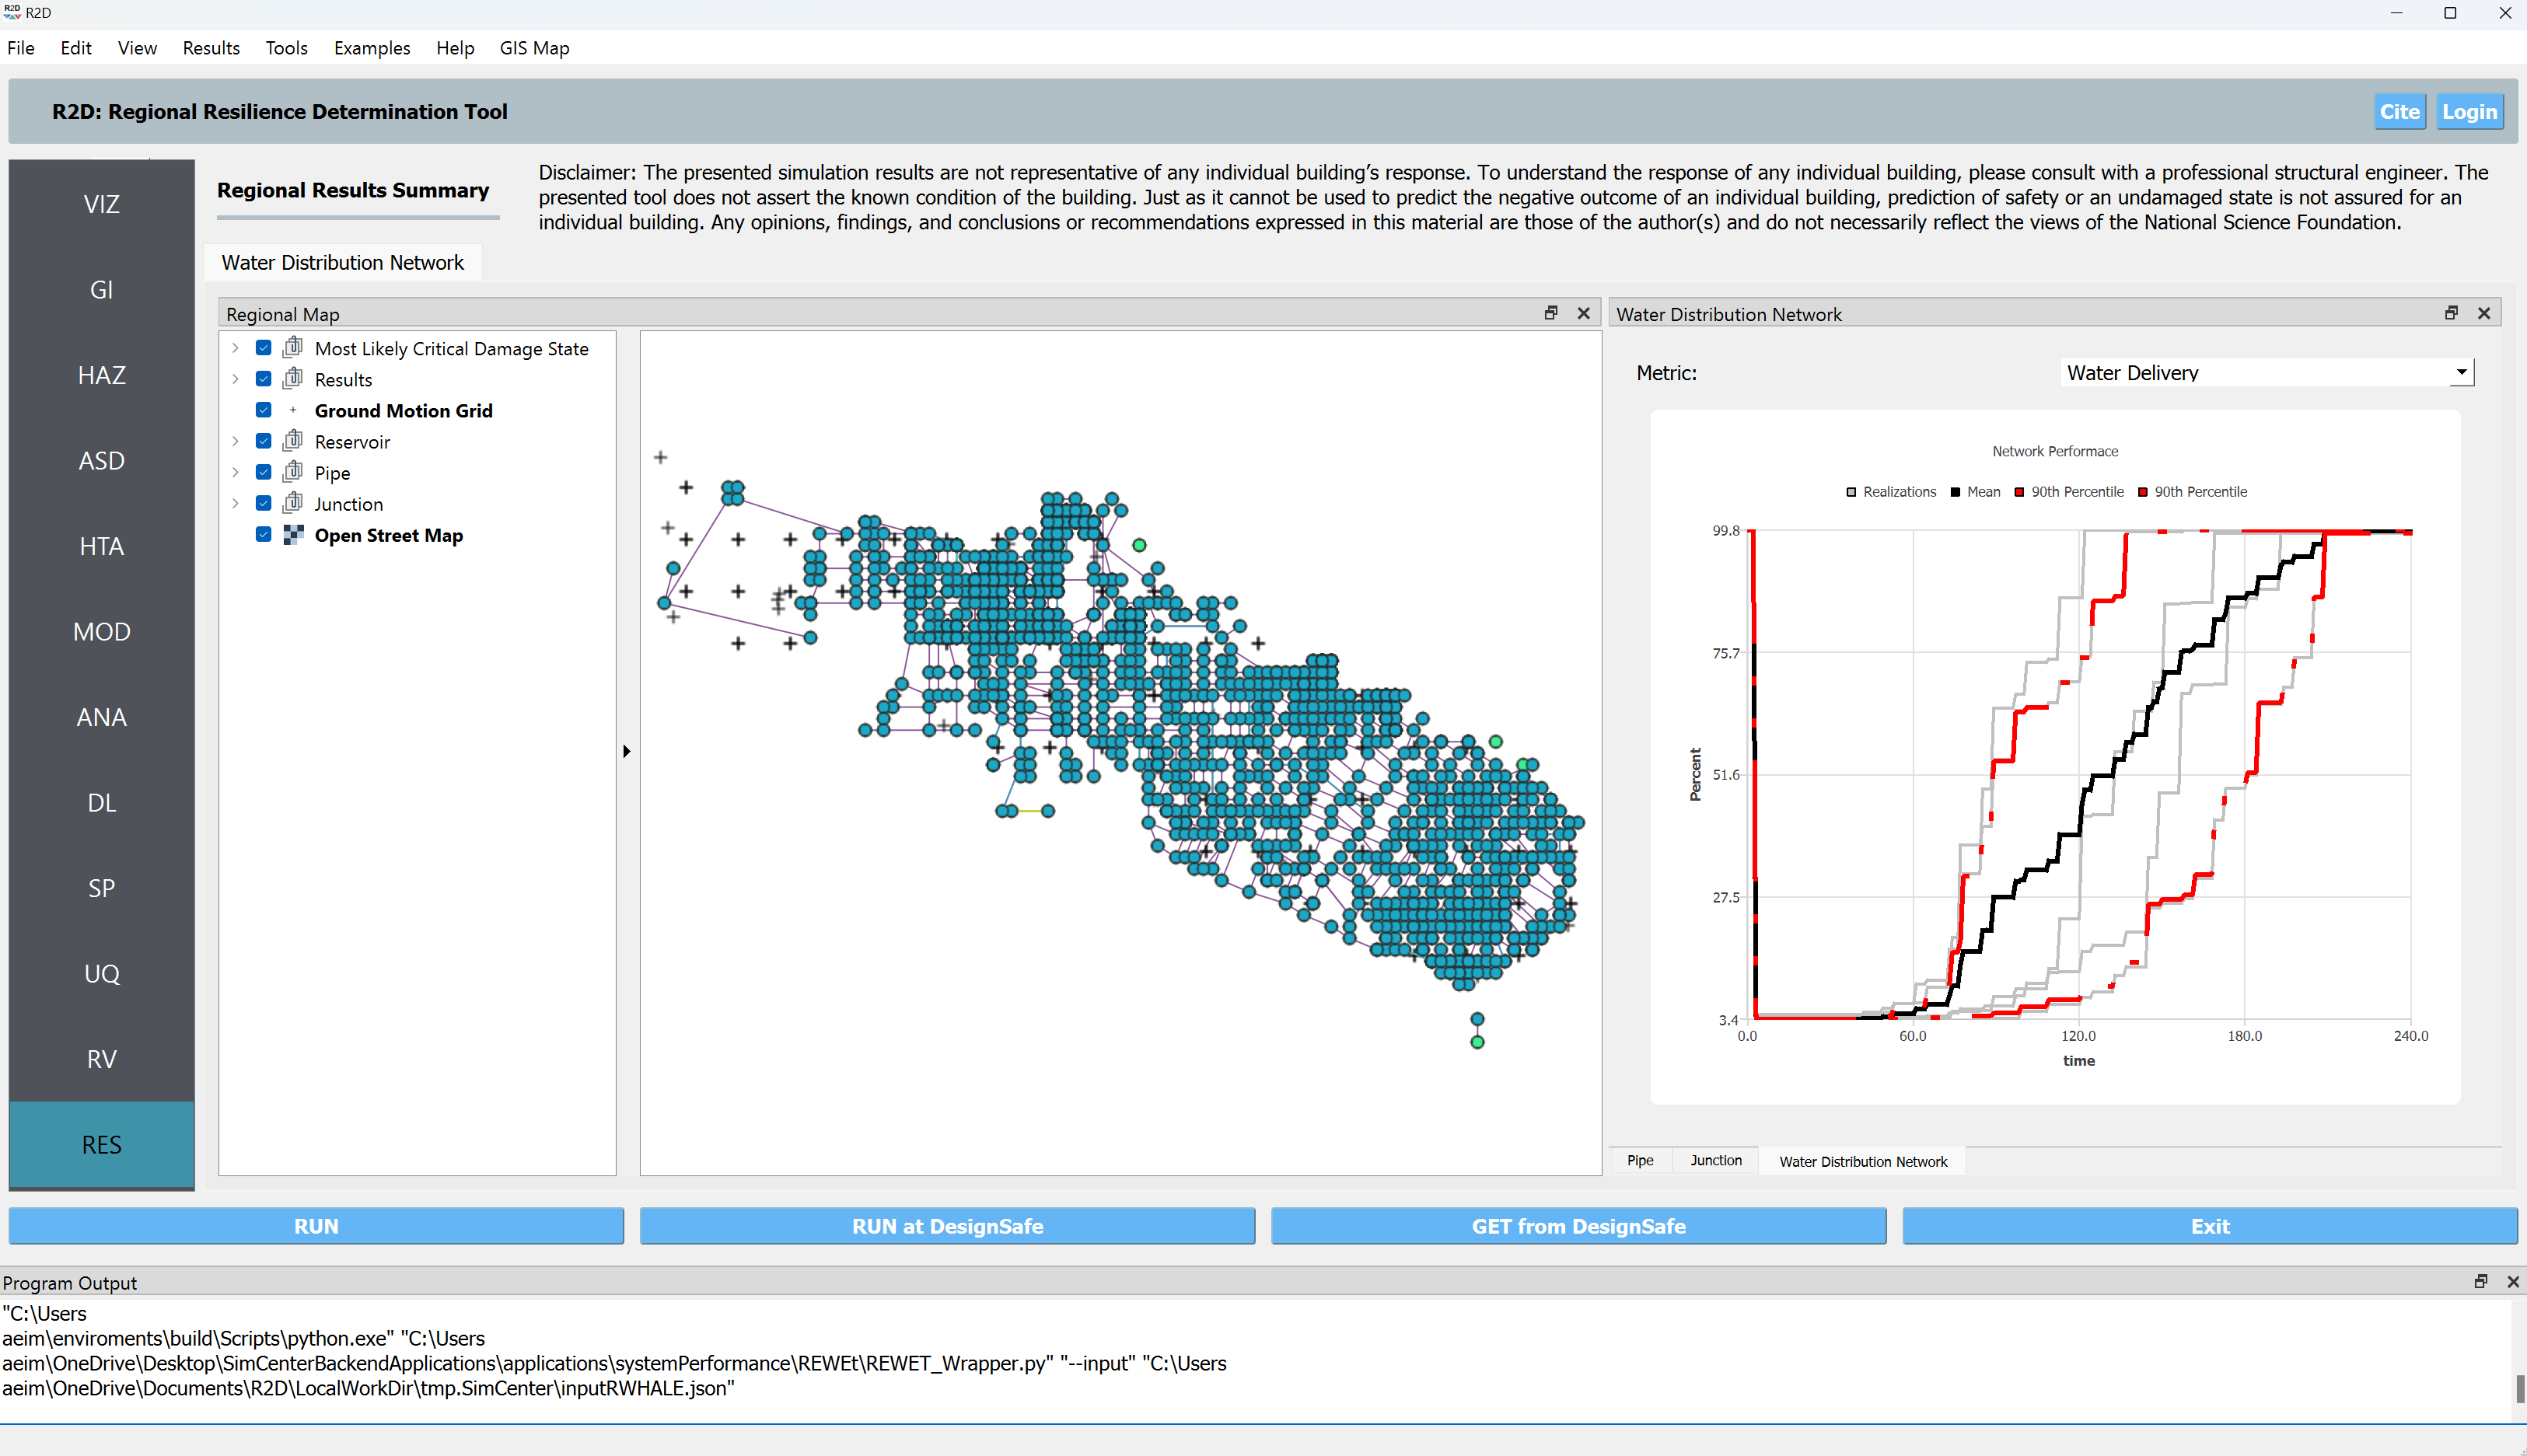
Fig. 2.13.2.1 REWET results visualization panel.
- Davis21
Davis, Craig A. “Understanding functionality and operability for infrastructure system resilience.” Natural Hazards Review 22.1 (2021): 06020005.