4.15. E19 - Basic HAZUS with Possible Worlds
Download files |
This earthquake example demonstrates how to include uncertainty related to asset attributes in the workflows.
In the GeoJSON form of an asset input, the properties of each asset are specified in the properties section. In an asset inventory with no uncertainty, each individual property has a single value. To express uncertainty in this property, the values are instead placed in a list. As an example, the following text is extracted from the SanFranciscoBuildings.geojson file. It shows the properties information for buildings 0 and 1. Building 0 has no uncertain properties, building 1 has two uncertain properties (number of stories and structure type), each with three possible values. Only buildings 1, 8001 and 8003 in this inventory have uncertain properties. Of these, 8001 and 8003 fall within the range of buildings analyzed in this example.
"features": [
  {
    "type": "Feature",
    "id": 0,
    "geometry":[...],
    "properties": {
      "Latitude": 37.796739,
      "Longitude": -122.403859,
      "HeightClass": "Low-Rise",
      "DesignLevel": "Pre-Code",
      "PlanArea": 7752,
      "NumberOfStories": 2,
      "YearBuilt": 1906,
      "ReplacementCost": 1022488.8,
      "StructureType": "C1",
      "OccupancyClass": "COM4",
      "type": "Building"
    }
  },
  {
    "type": "Feature",
    "id": 1,
    "geometry":[...],
    "properties": {
      "Latitude": 37.7996,
      "Longitude": -122.419356,
      "HeightClass": "",
      "DesignLevel": "Pre-Code",
      "PlanArea": 3600,
      "NumberOfStories": [3,2,1],
      "YearBuilt": 1931,
      "ReplacementCost": 6843570.3,
      "StructureType": ["W2","W1","W1"],
      "OccupancyClass": "RES3",
      "type": "Building"
    }
  },
  ...
]
Note
The current workflow assumes that if an asset has more than one uncertain quantity in lists, the lengths of these lists are the same for that asset.
BRAILS++ will generate such inputs when the number of possible worlds is set to > 1, for properties of assets for which imputation is required or for properties of assets for which validators have been used and these validators have worked with imputed data.
The difference in inputs provided to R2D between this example and E1 is in the Asset Description Panel, ASD. The user is referred to E1 for discussion on all other inputs.
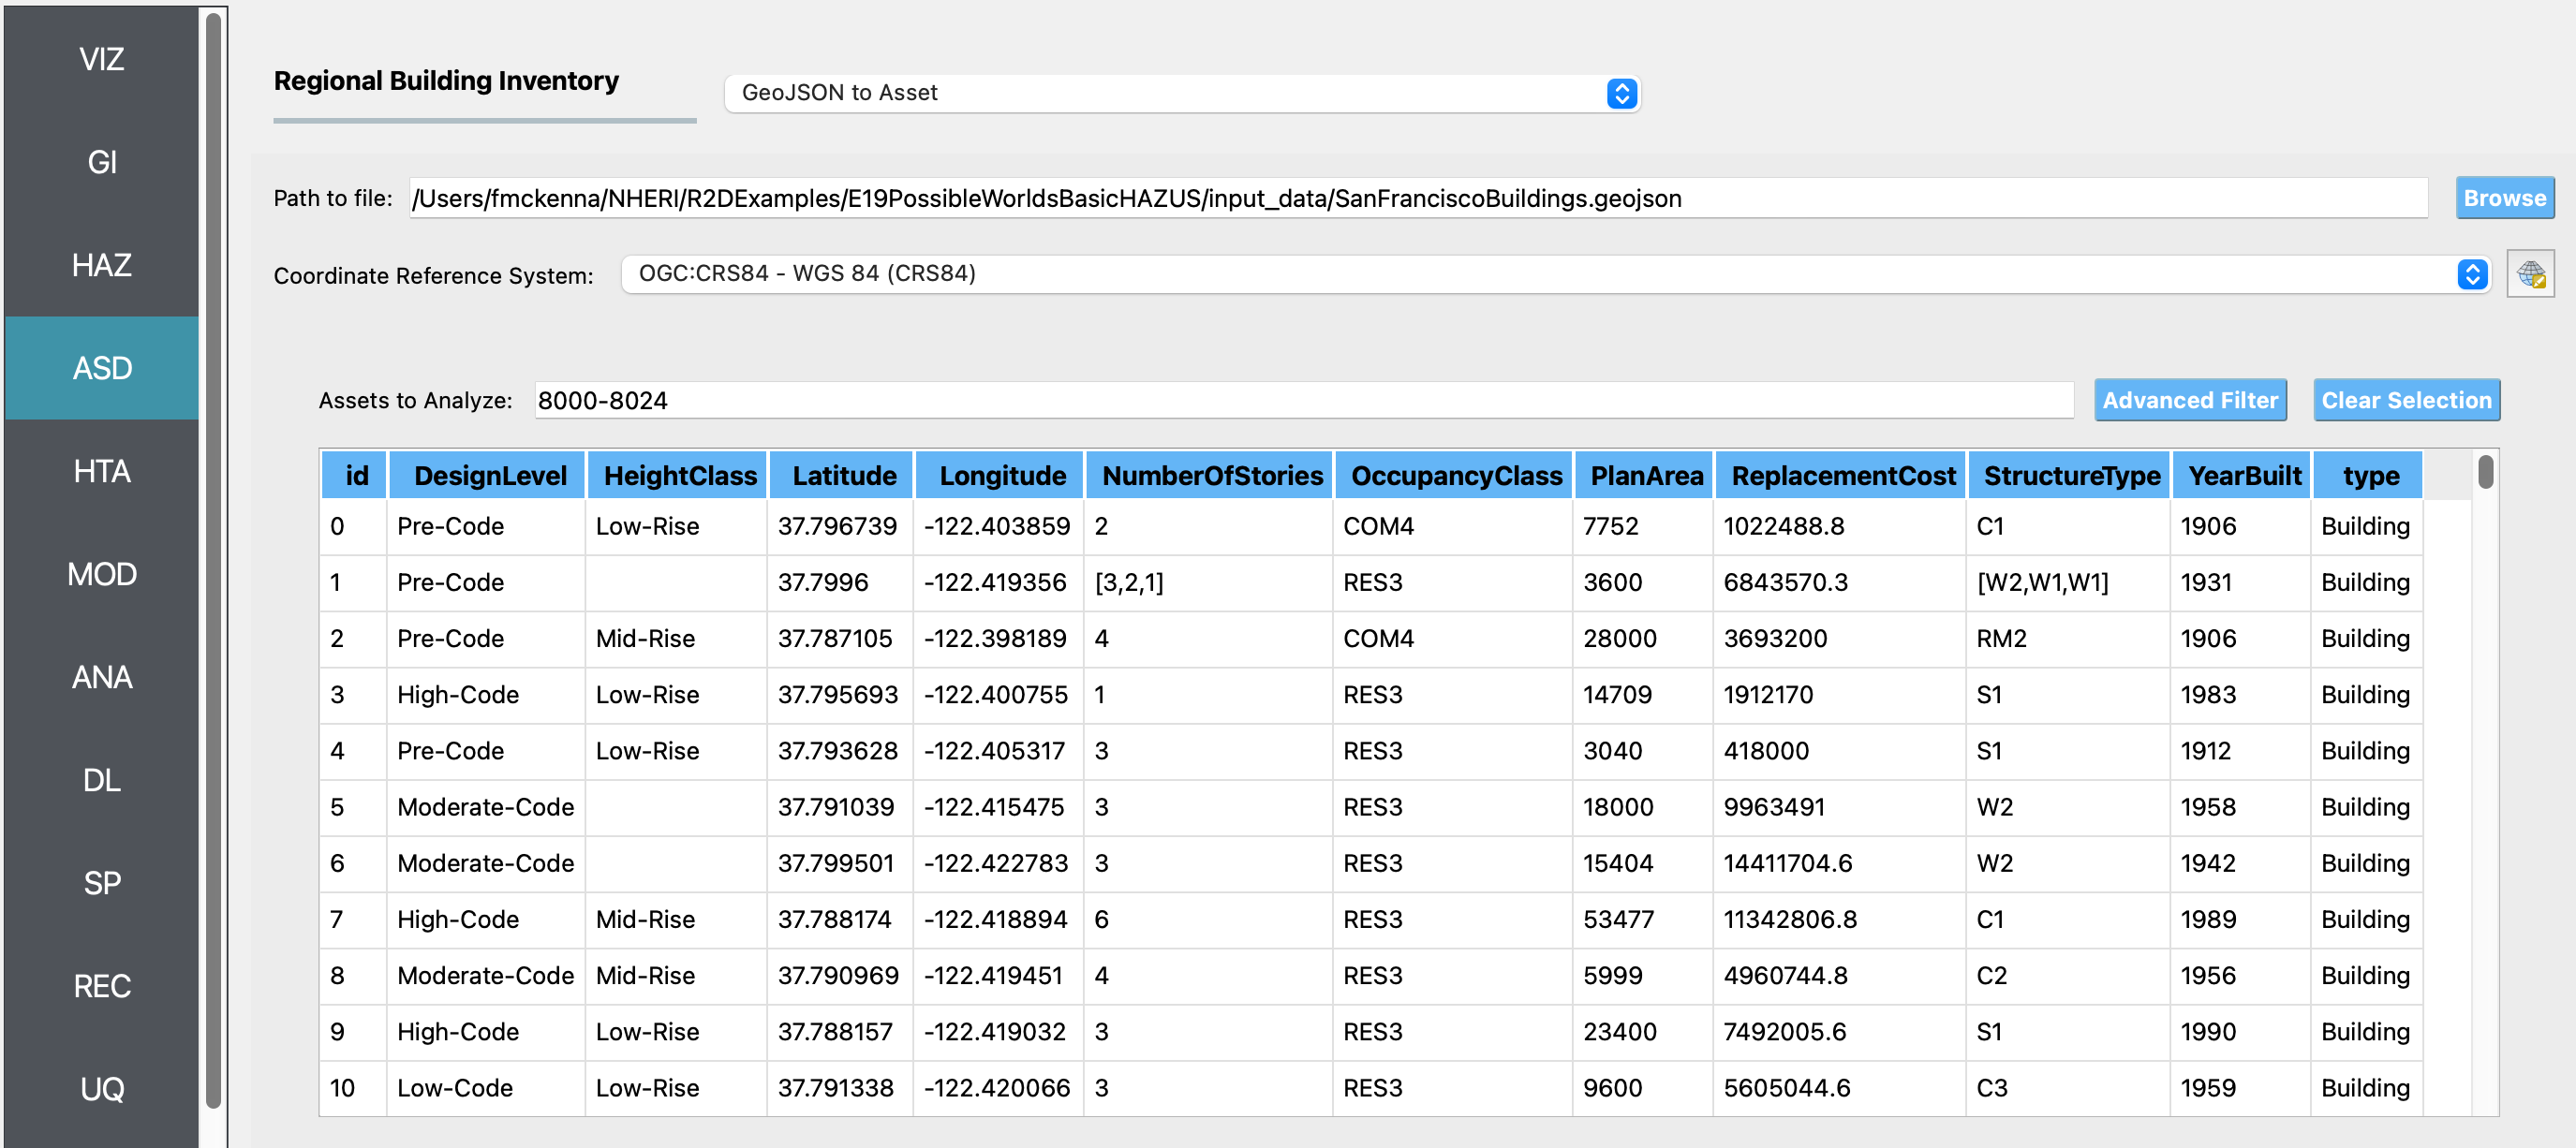
ASD In the asset description panel, the GeoJSON to Asset option is used to provide information on the assets as opposed to the CSV to AIM option. Three inputs are required: 1) the path to the GeoJSON file, SanFranciscoBuildings.geojson, 2) the Coordinate Reference System, for this file OGC:CRS84, and 3) the Assets to Analyze, that being the range of assets to be analyzed in the workflow. The GeoJSON file contains a list of features, each with an id, geometry and properties. The properties section contains a number of properties for each asset: Latitude, Longitude, HeightClass, DesignLevel, PlanArea, NumberOfStories, YearBuilt, ReplacementCost, StructureType, OccupancyClass, and type. The type for all assets in this file is Building. For this example, as the figure shows, only buildings 8000-8024 have been selected.
Note
The range of assets uses the ids of the buildings provided in the asset inventory file.
By default NO ASSETS will be analyzed unless the range is filled in.
The user can provide a comma separated list of assets that includes ranges, e.g. 1,2,3,5-10,100-1000.
Once the range has been filled in, the user can view the selected buildings by going to the VIZ panel, looking at the buildings layer and selecting the Selected Buildings, and de-selecting All Buildings.
If the user does not like the selections, the Clear Selection button in the ASD panel can be pressed.
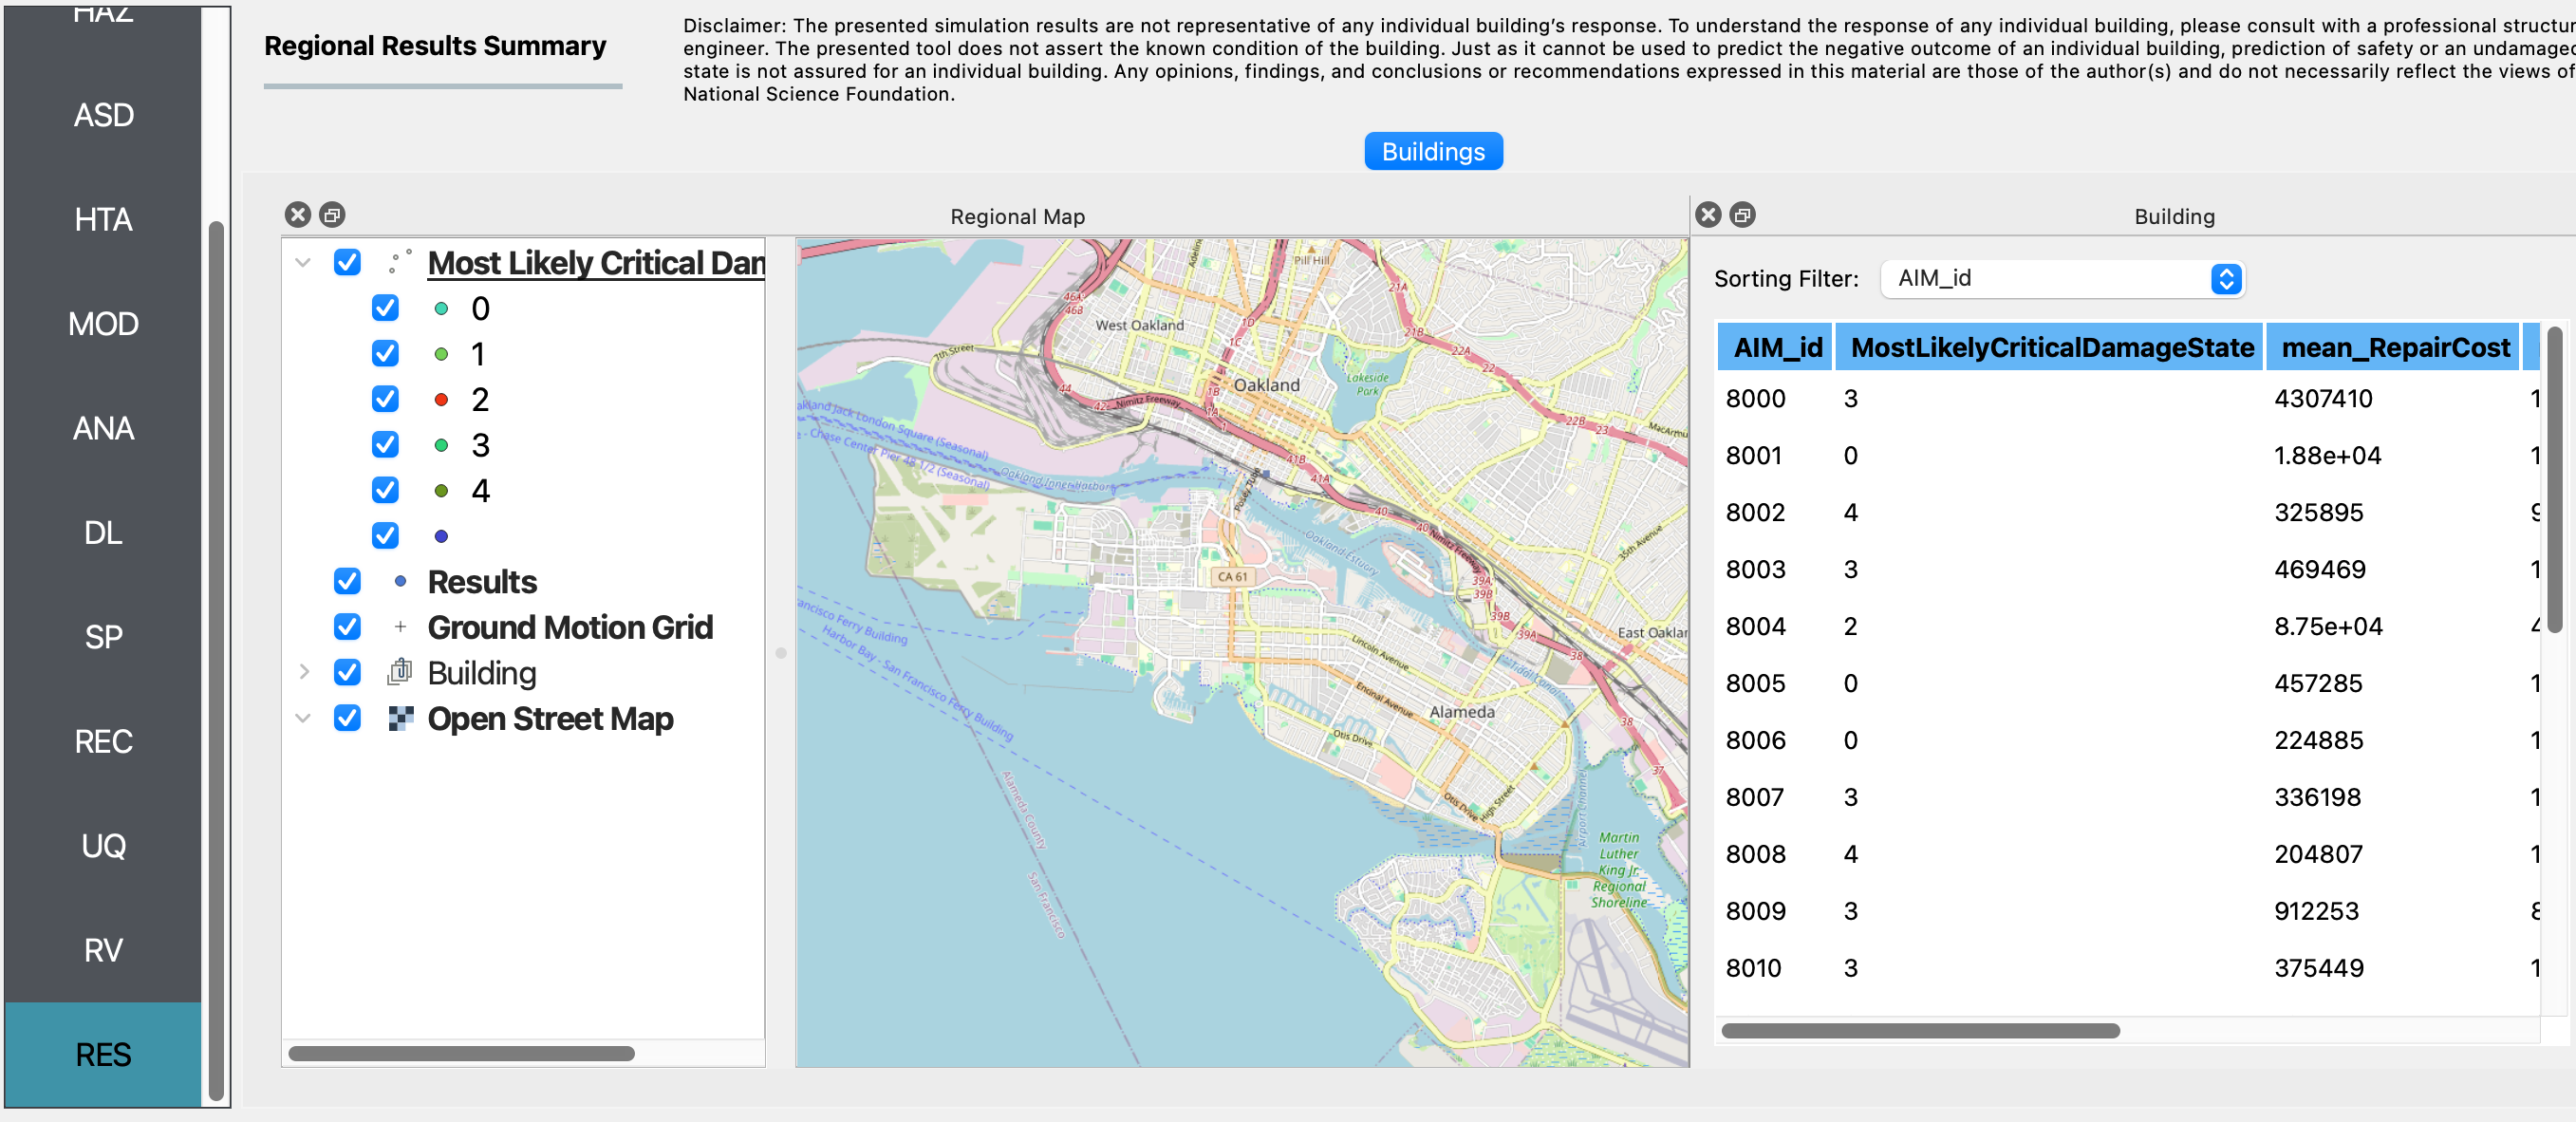
RES Once the example has been run, using either the RUN button or the RUN at DesignSafe and Get from DesignSafe buttons, the results panel is shown automatically. The Buildings tab contains two windows, each of which can be separated from the main application:
The Regional Map window is the QGIS view from the VIZ panel, with a new Results layer added. Deselect the other layers to review the Most Likely Critical Damage State of the 25 selected buildings (8000-8024).
The Building window lists the results for each building in a table. Left or right click on a column to get statistics for its entries, e.g. min, max, mean, mode and histograms.